历史 - 粒度
State granularity is a feature that allows users to adjust the level of detail at which device state measurements are presented. This control over granularity provides crucial flexibility for monitoring, as users can choose how data is presented based on the context and analysis needs.
This feature is available in the history and comparative history widgets.
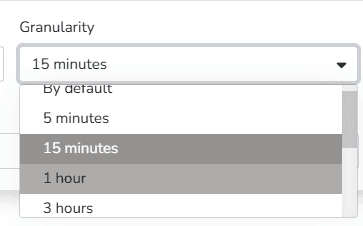
The available time ranges are:
- Default
- 5 minutes
- 15 minutes
- 1 hour
- 3 hours
- 12 hours
- Day
- Week
- Biweekly
- Month
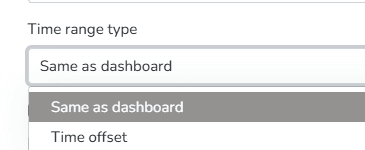
These measurements will be displayed according to the 选择ed time range, for the period indicated in the filter if the 仪表盘 option is 选择ed in the Time Range Type 选择or, or according to the period indicated if the Time Offset option is 选择ed.
The state granularity feature provides essential control over data presentation in monitoring systems. 用户 can adjust the granularity according to the level of detail they need for efficient analysis. This flexibility facilitates the interpretation of large volumes of data and optimizes decision-making based on the specific monitoring or analysis needs of each user.
最后更新于
历史 - Grid
The platform includes predefined widgets that facilitate data presentation in dashboards. Among them are the history and comparative history widgets. They allow viewing the evolution of 端点 measurements over time.
历史 - 聚合
Another feature of the history and comparative history widgets is the ability to view aggregated (grouped) measurements through different calculations.