创建组和小部件
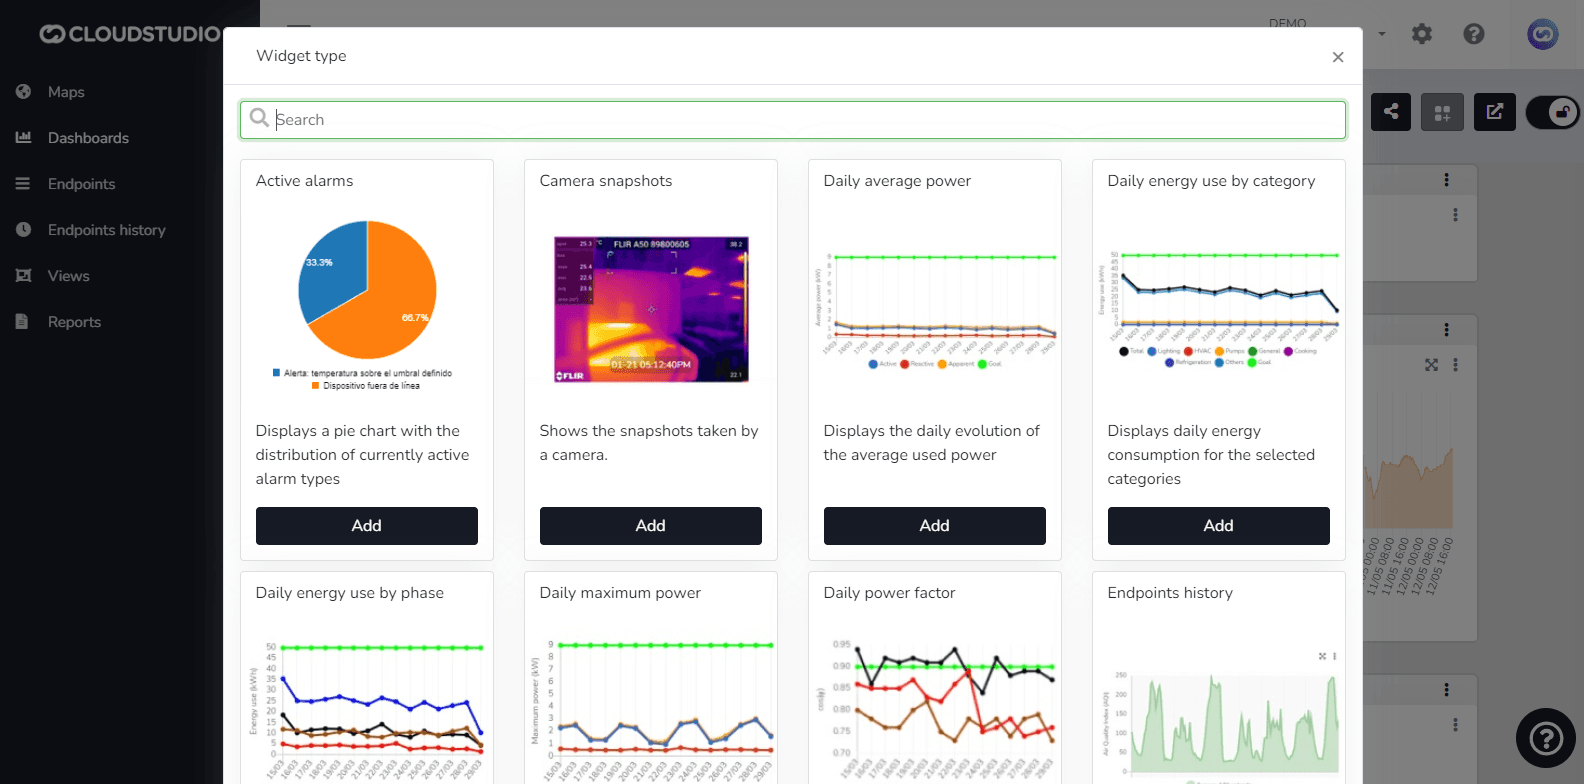
The platform includes predefined widgets that facilitate data presentation in dashboards. Some of the available widgets are:
- Active alarms: displays a pie chart with the distribution of currently active alarm types.
- 警报 counter: Displays a counter of active alarms, allowing hierarchy indication.
- Individual alarm counter: Displays a counter of active alarms, allowing severity and hierarchy indication.
- Past and projected energy consumption: shows past energy consumption and targets, as well as a projection of consumption and targets for the coming days.
- Energy consumption by category: shows energy consumption for 选择ed categories.
- Energy consumption by phase: pie chart showing energy consumption by phase.
- Daily energy consumption by category: shows daily energy consumption for 选择ed categories.
- Daily consumption by phase: shows daily consumption by phase for 选择ed categories.
- Energy cost by category: shows the energy cost for 选择ed categories.
- Past and projected energy costs: shows past energy costs and targets, as well as a projection of costs and targets for the coming days.
- Weather status: shows the current weather status of the facility.
- Daily power factor: shows the daily evolution of the power factor.
- Infrastructure: shows the current availability of the infrastructure.
- 设施 map: shows a map containing the location of the current facility.
- Energy consumption targets: shows energy consumption information relative to defined targets.
- Daily maximum power: shows the maximum daily power used in a 15-minute period.
- Daily average power: Shows the daily evolution of the power used.
- 设施 summary: shows summary information for the current facility.
- Global summary: shows summary information for all facilities.
- Latest events: Displays a list of the most recent events.
- 端点 history: line chart showing the variation of an endpoint variable type over time.
- Comparative endpoint history: line chart showing the comparative variation of two endpoint variable types over time.
- Metric: Displays the value of a variable in real time.
- 视图: Displays a SCADA-type view designed in the views section.
These widgets can be edited individually or grouped together.
Whether you want to create a widget or a group of widgets, navigate to the Add element button found on the 仪表盘 screen.

If you 选择 the Add widget option, a screen with the available widgets will appear.
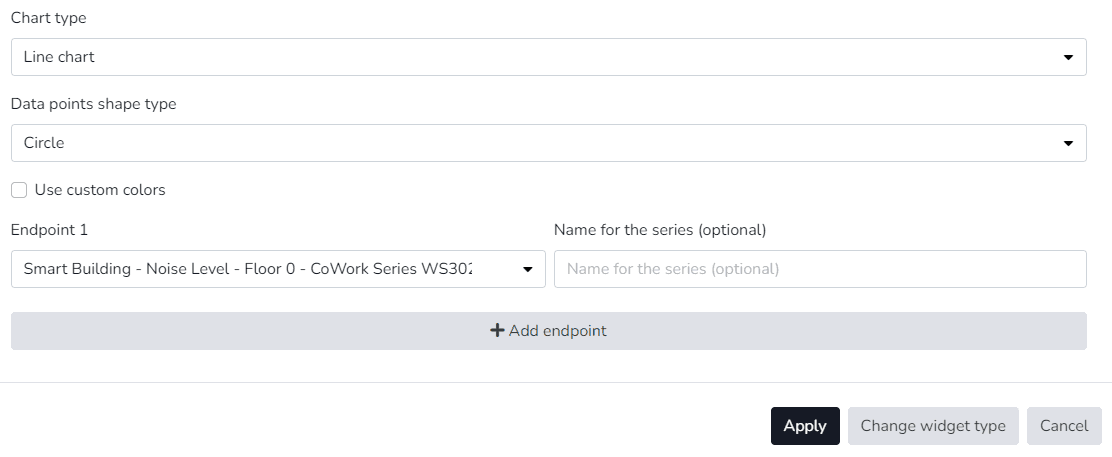
Each widget has a different configuration screen depending on the data it needs to collect.
示例 of a Comparative endpoint history widget:
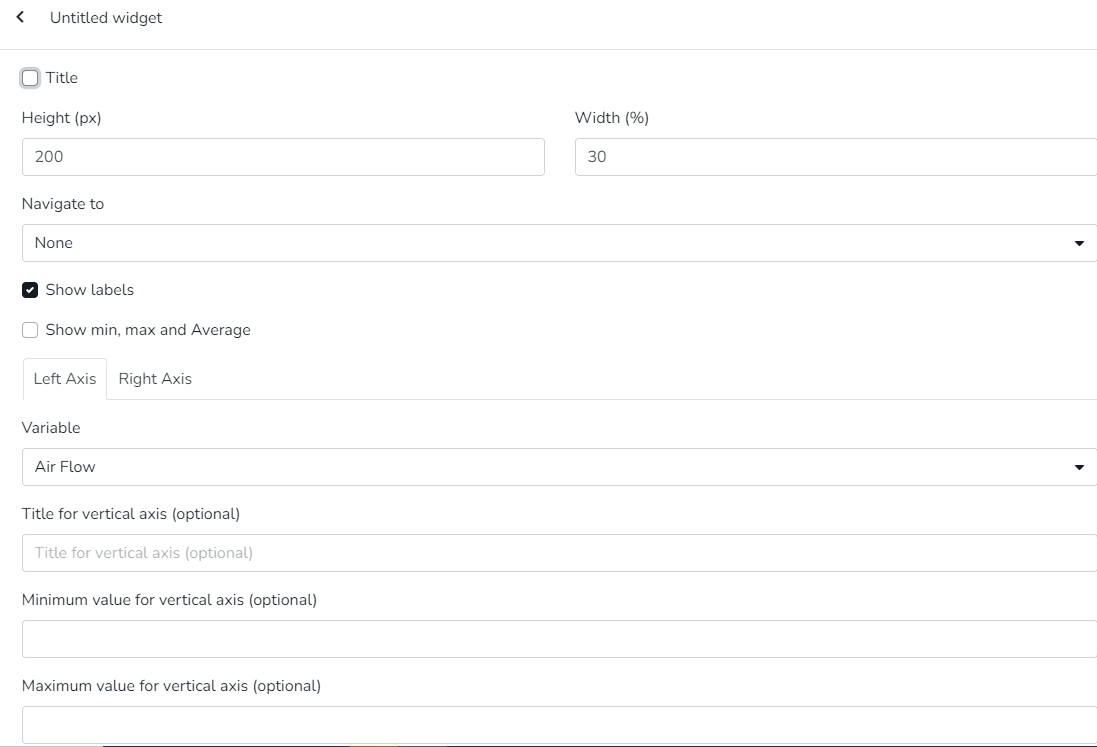
For all widgets, you can define a name, dimensions (height and width), and whether 点击ing should redirect to another dashboard (navigation). The name and navigation option are not mandatory.
To add a new group, follow the same procedure but 选择 the Add group button. The following screen will appear:
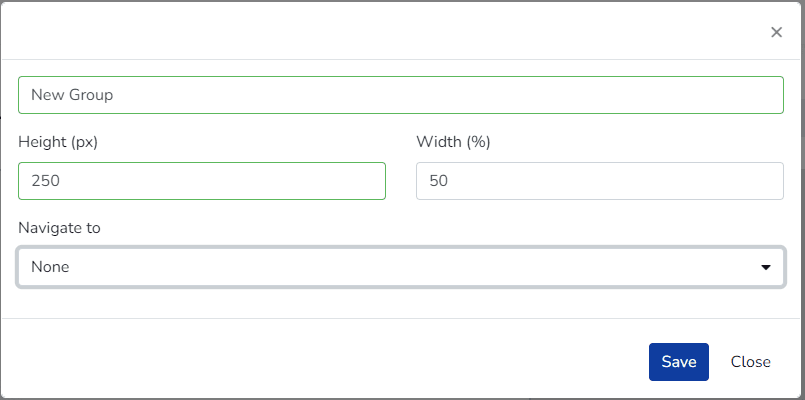
New Group Addition
Once the Save button is 按下ed, the group will be visible in the dashboard.
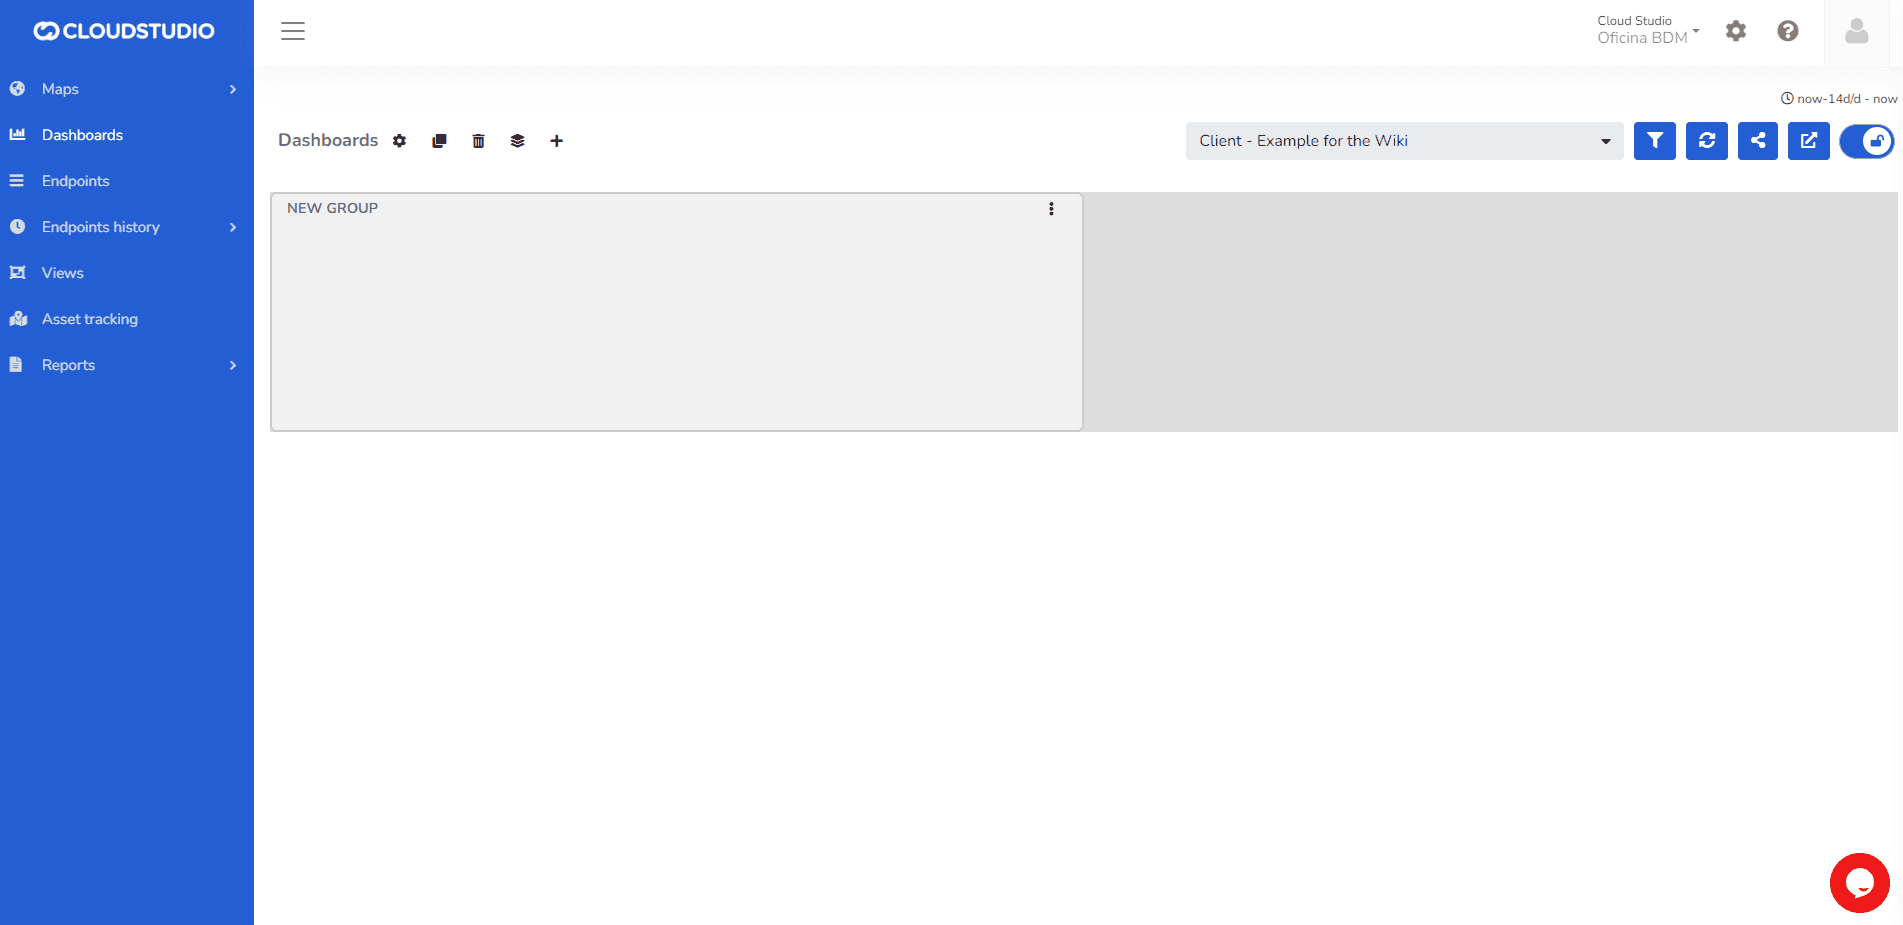
New Group Addition
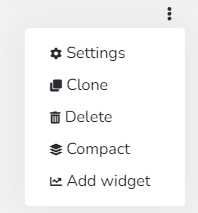
To add widgets inside the created group, look for the Add widget option in the three dots located in the upper right corner of the group.
示例 of a widget inside a group.
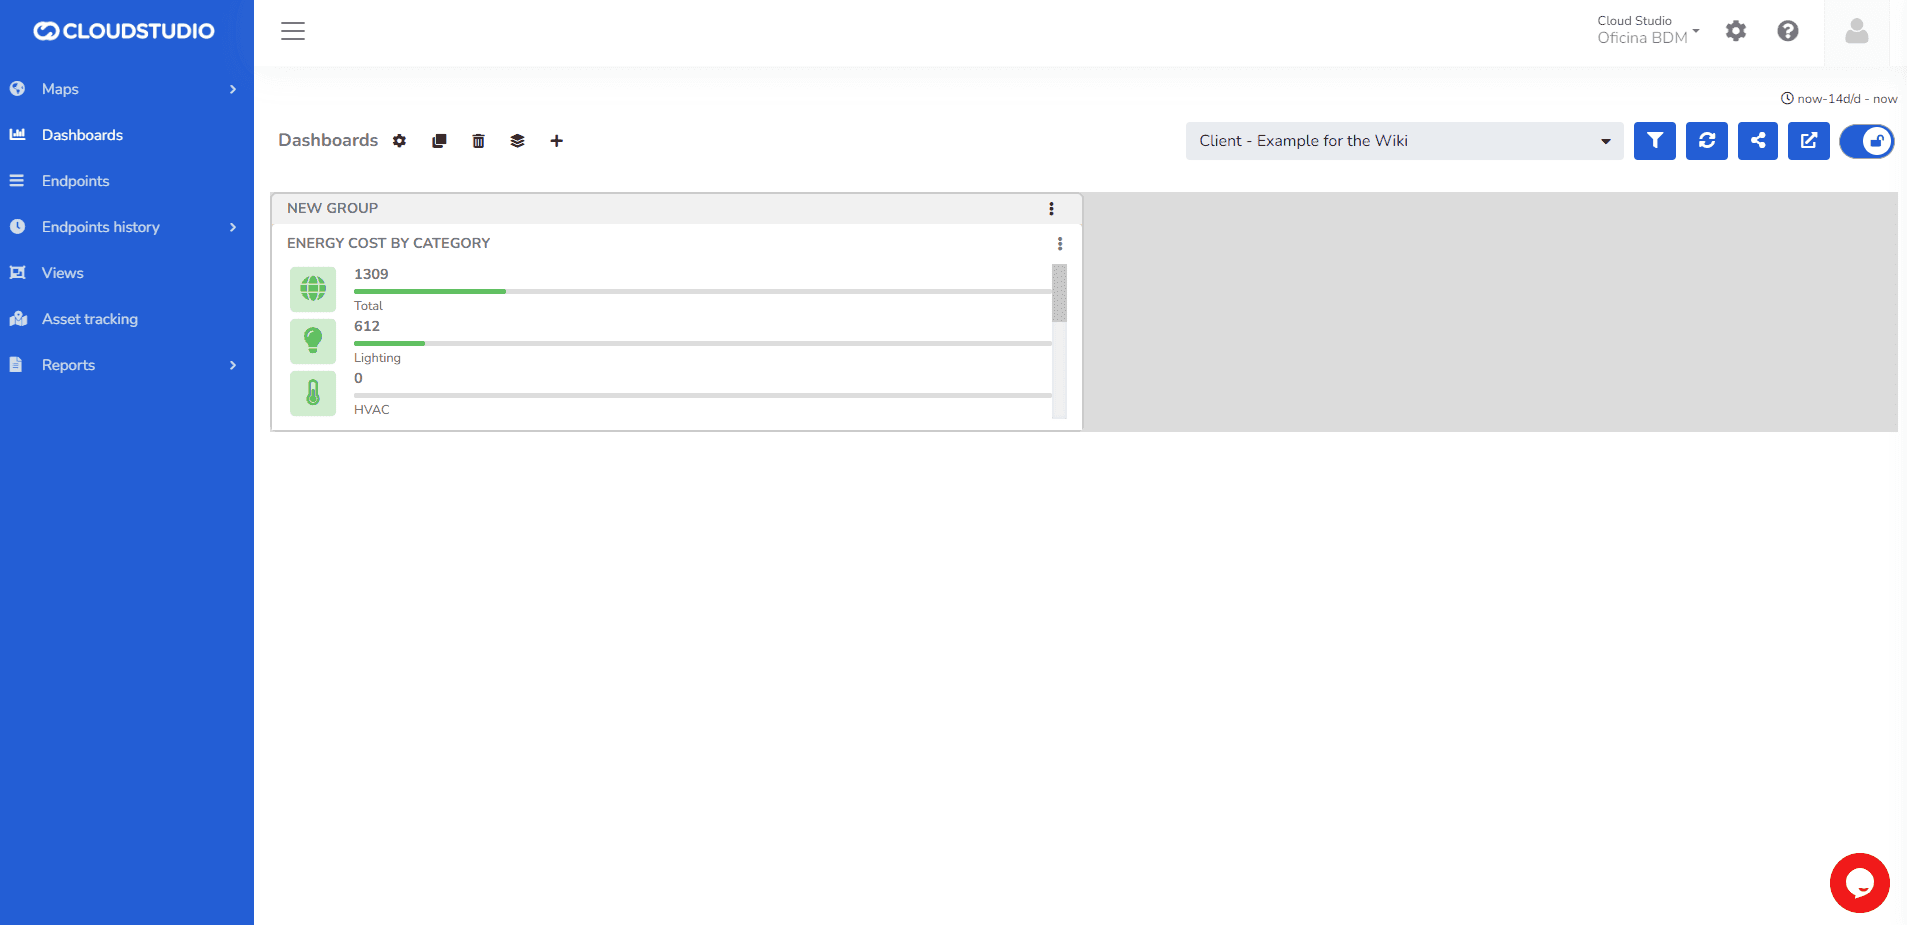
New 小部件 into a Group
最后更新于
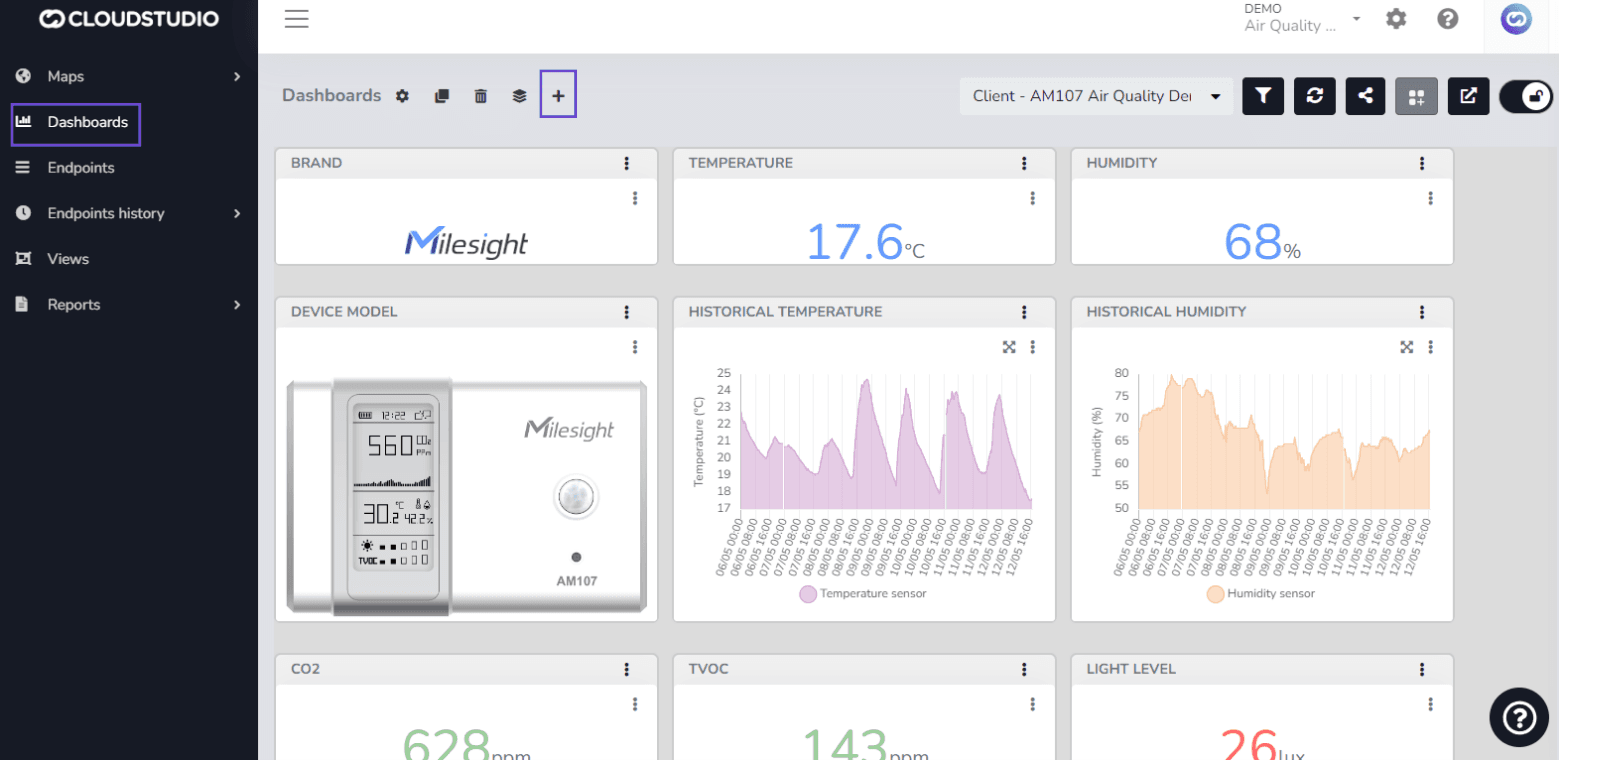
创建仪表盘
To create a new dashboard, navigate to the 仪表盘 menu in the Monitor and 按下 the Add 仪表盘 button. The user can add a 说明 and 说明 in the Details tab as needed.
编辑组和小部件
仪表盘 Design editing is tied to each user's permissions. If the user has the required permission, they can use the edit button located in the upper right corner of the dashboards when 输入ing the 仪表盘 option in the Monitor menu.