History - Aggregation
Another feature of the history and comparative history widgets is the ability to view aggregated (grouped) measurements through different calculations.
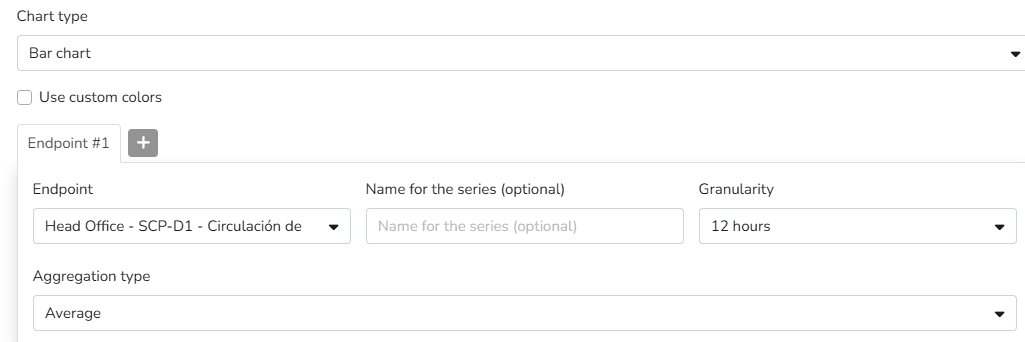
The available options for aggregation calculations are:
- Default
- Minimum: the resulting value is the minimum of all states or measurements recorded in a specific time interval.
- Maximum: the highest value of all states or measurements during a time period.
- Average (mean): the average of all measurement values recorded in a given interval is calculated.
State aggregation is an extremely useful tool for synthesizing and presenting device data in a more understandable and useful way. The different aggregation methods allow users to choose the strategy that best suits their analysis and decision-making needs. This functionality optimizes monitoring and facilitates the detection of patterns and important events in complex systems.
Última atualização em
History - Granularity
State granularity is a feature that allows users to adjust the level of detail at which device state measurements are presented. This control over granularity provides crucial flexibility for monitoring, as users can choose how data is presented based on the context and analysis needs.
Histórico — Tempo de Desconexão
Há ocasiões em que um dispositivo se desconecta, mas as medições continuam sendo geradas. Quando o dispositivo se reconecta, as medições armazenadas desse dispositivo são automaticamente sincronizadas com o sistema, permitindo que o usuário veja a sequência completa de dados sem intervenção manual.