Dashboards
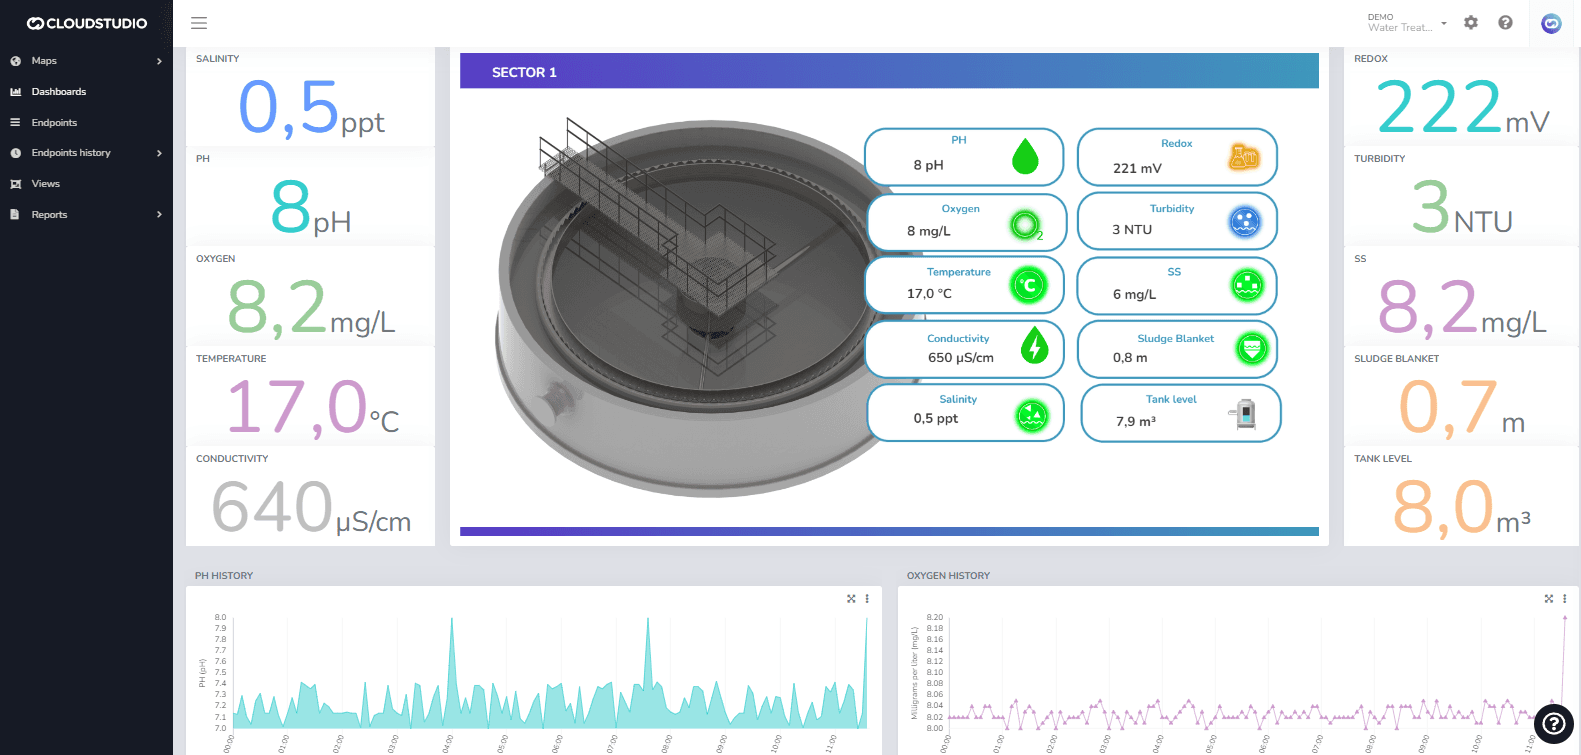
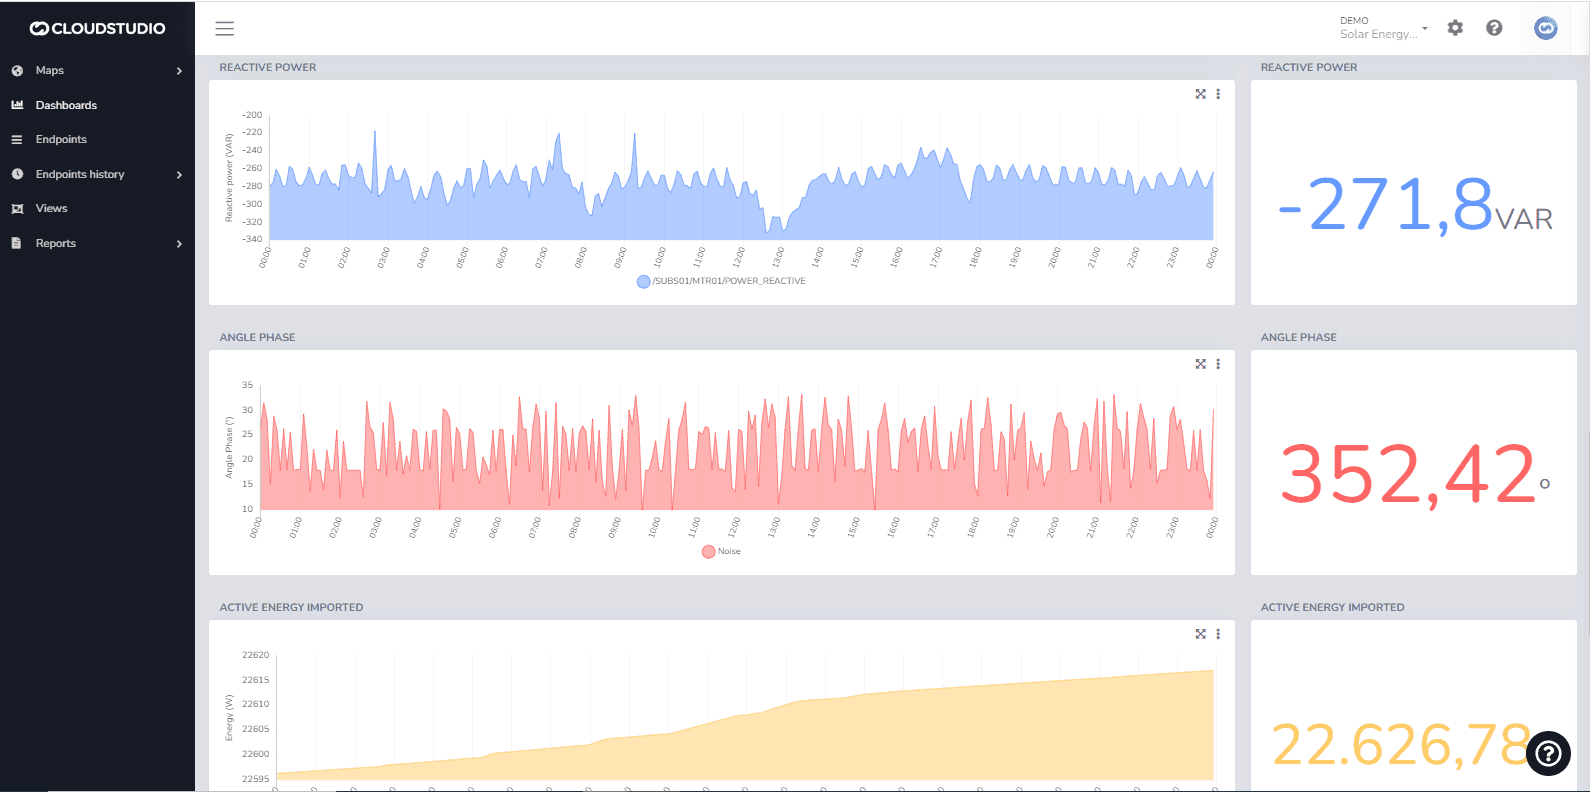
A Dashboard is a graphical screen designed to present data and information in a visual, quick, and clear manner. Dashboards help users make data-driven decisions from multiple sources.
The Cloud Studio platform features a series of specific widgets for branch monitoring, energy consumption, variable history, real-time metrics, weather data, and more, for use in dashboards customizable by the end user.
Since platform version 1.2.20, all dashboard features have been relocated and unified in the Monitor application.
To learn more about creating dashboards and the new drag & drop features, start here or watch this video on YouTube.
Última atualização em
Mapa de Facilities
Introdução: O mapa de facilities permite visualizar todas as facilities do cliente para as quais o usuário tem permissões. Habilitando o mapa de facilities: para habilitar esta funcionalidade e exibir a tela de facilities no monitor, é necessário configurar a permissão do cliente marcando a opção "Habilitar mapa de facilities" como mostrado na imagem a seguir.
Create Dashboards
To create a new dashboard, navigate to the Dashboards menu in the Monitor and press the Add Dashboard button. The user can add a Description and Comments in the Details tab as needed.