ThingPark X IoT Flow (Actility)
The integration with ThingPark X IoT Flow allows the Cloud Studio IoT Platform to communicate with LoRaWAN devices using a variety of gateways available on the market. This article describes the steps necessary to complete the integration.
Requirements
Prior to integration, the user must have:
- An instance identifier. Depending on your Gear Studio subscription, the most common instance names are:
- gear.cloud.studio. This instance name corresponds to a common Gear Studio instance, including the free version.
- xxxx.cloud.studio. This instance name corresponds to Flex instances where hosting is provided by Cloud Studio, but the client can choose the subdomain used (xxxx).
- Other. For Enterprise clients using their own domain, the chosen domain name should be used.
- An Access Token. Data sent from TPX will use this access token to access the platform, and therefore TPX will have the permissions associated with this access token. It is recommended to create a new access token specifically for the TPX integration to simplify security control.
Creating a Connection with UI
Log in to community.thingpark.io. Then follow these steps:
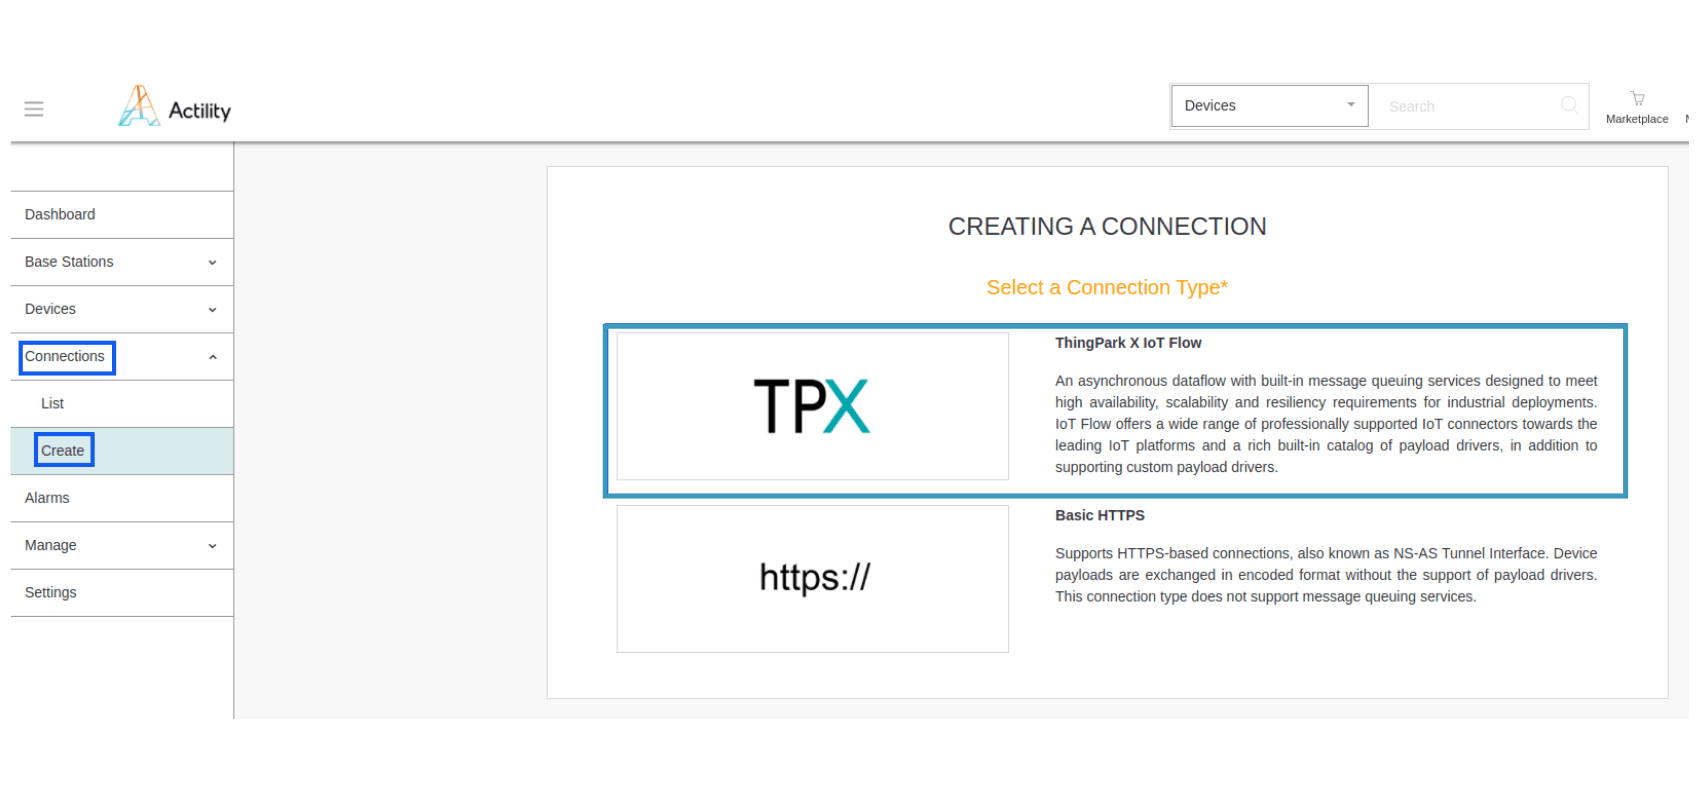
- Click on Connections -> Create -> ThingPark X IoT Flow.
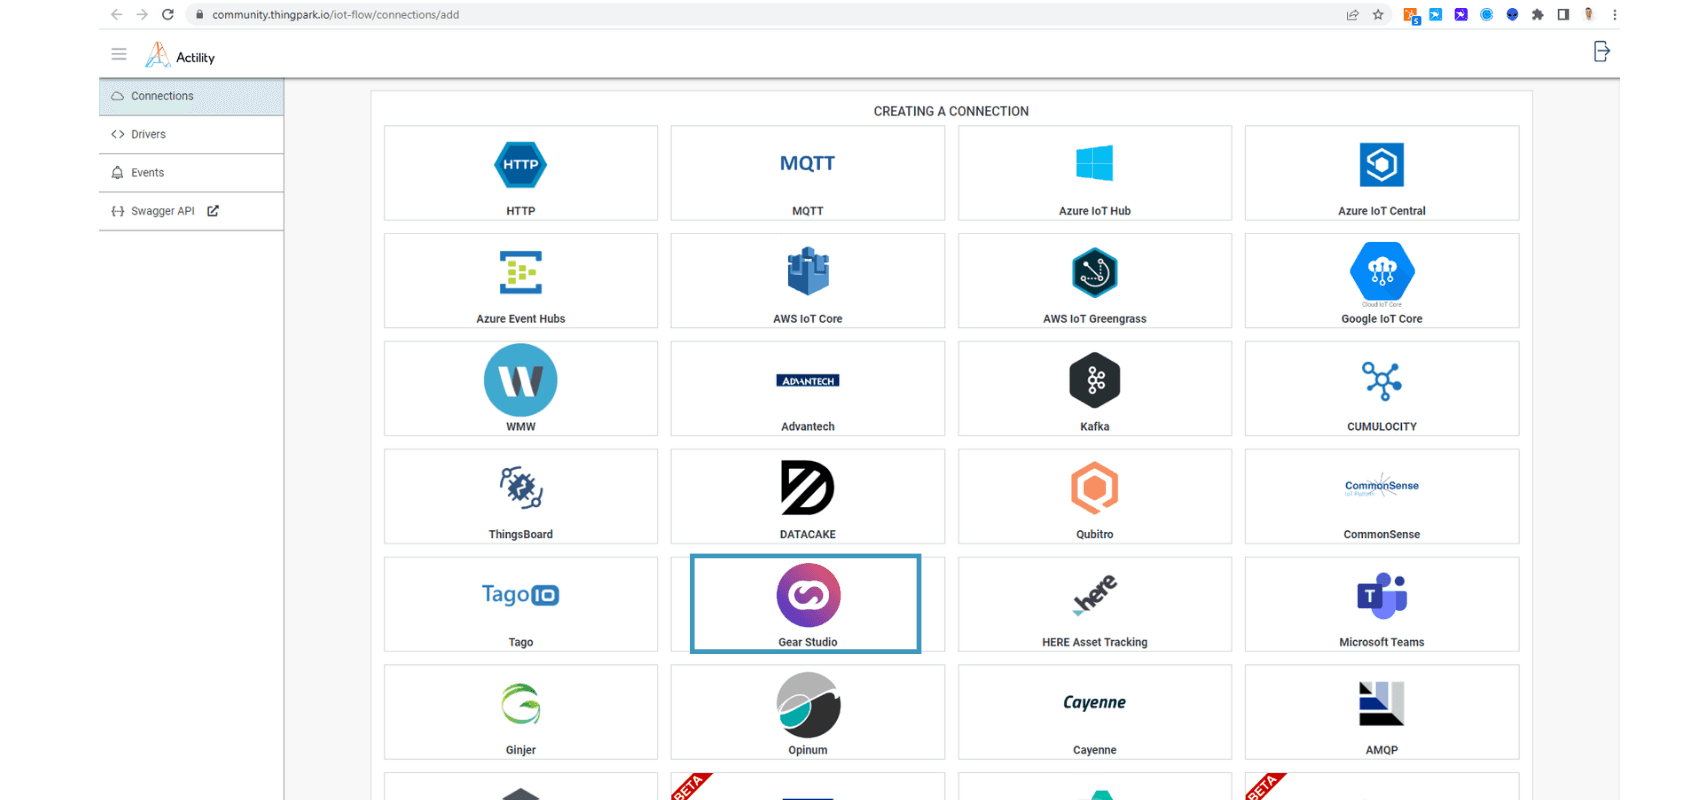
- A new page will open. Select the connection type: Gear Studio.
- Complete the form as shown in the following example and click Create.
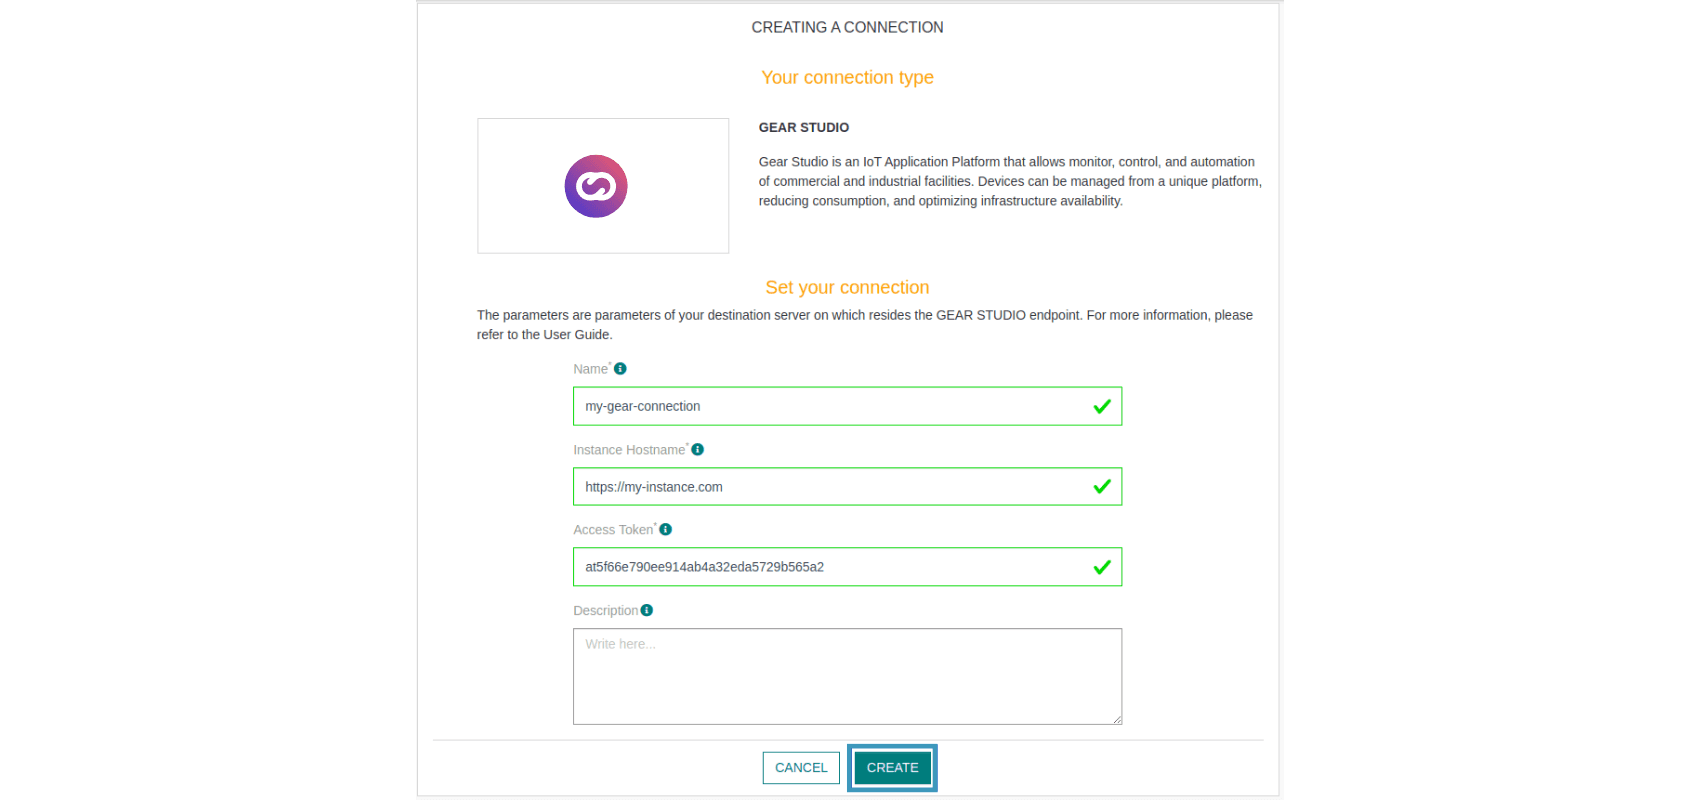
Note Parameters marked with * are mandatory.
- A notification will appear in the upper right corner of your screen to confirm that the application has been created.
- After creating the application, you will be redirected to the connection details.
Viewing Information on the Cloud Studio IoT Platform
Connect to your Gear Studio instance and navigate to the configuration.
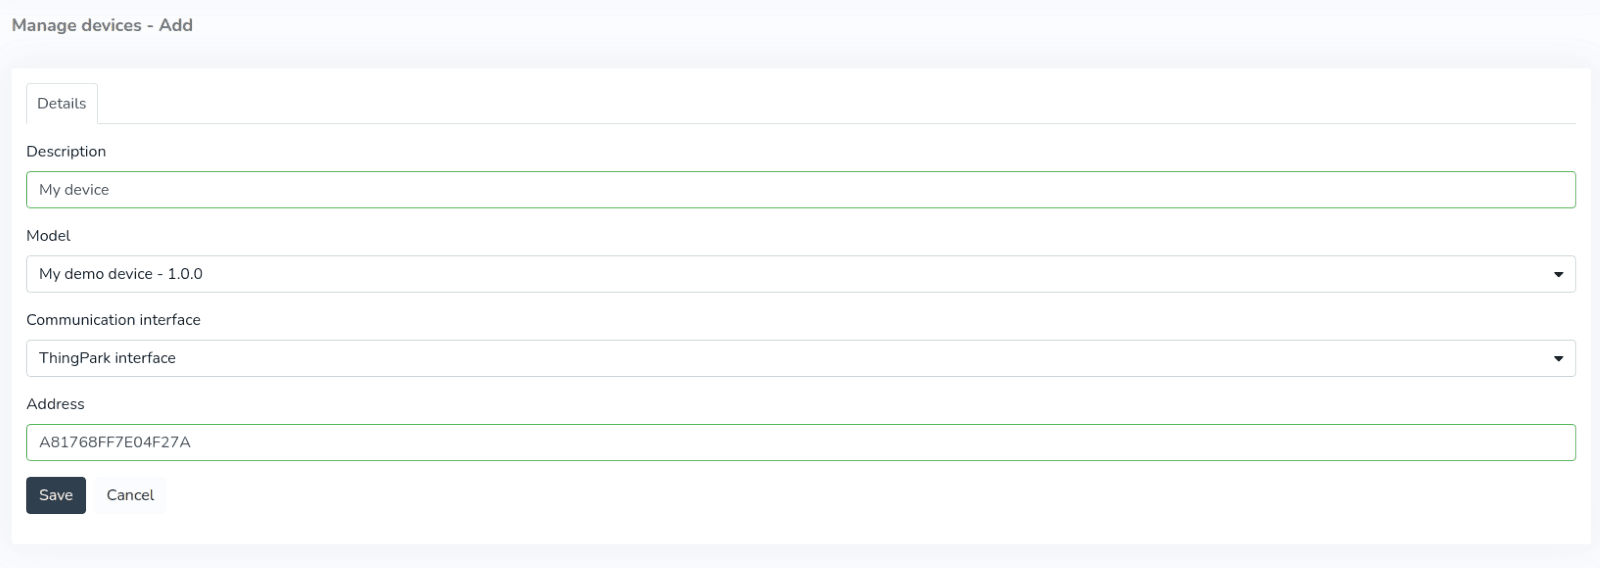
- Go to the Devices section and click the Add button to create a new Device.
_bc3f.png&w=1920&q=75&dpl=dpl_H3XnPBpQP9upyjh7HhQPFEaqGfX6)
- Fill in the form using the Device Model created earlier. The Address field corresponds to your Device EUI (find it in the ThingPark device list).
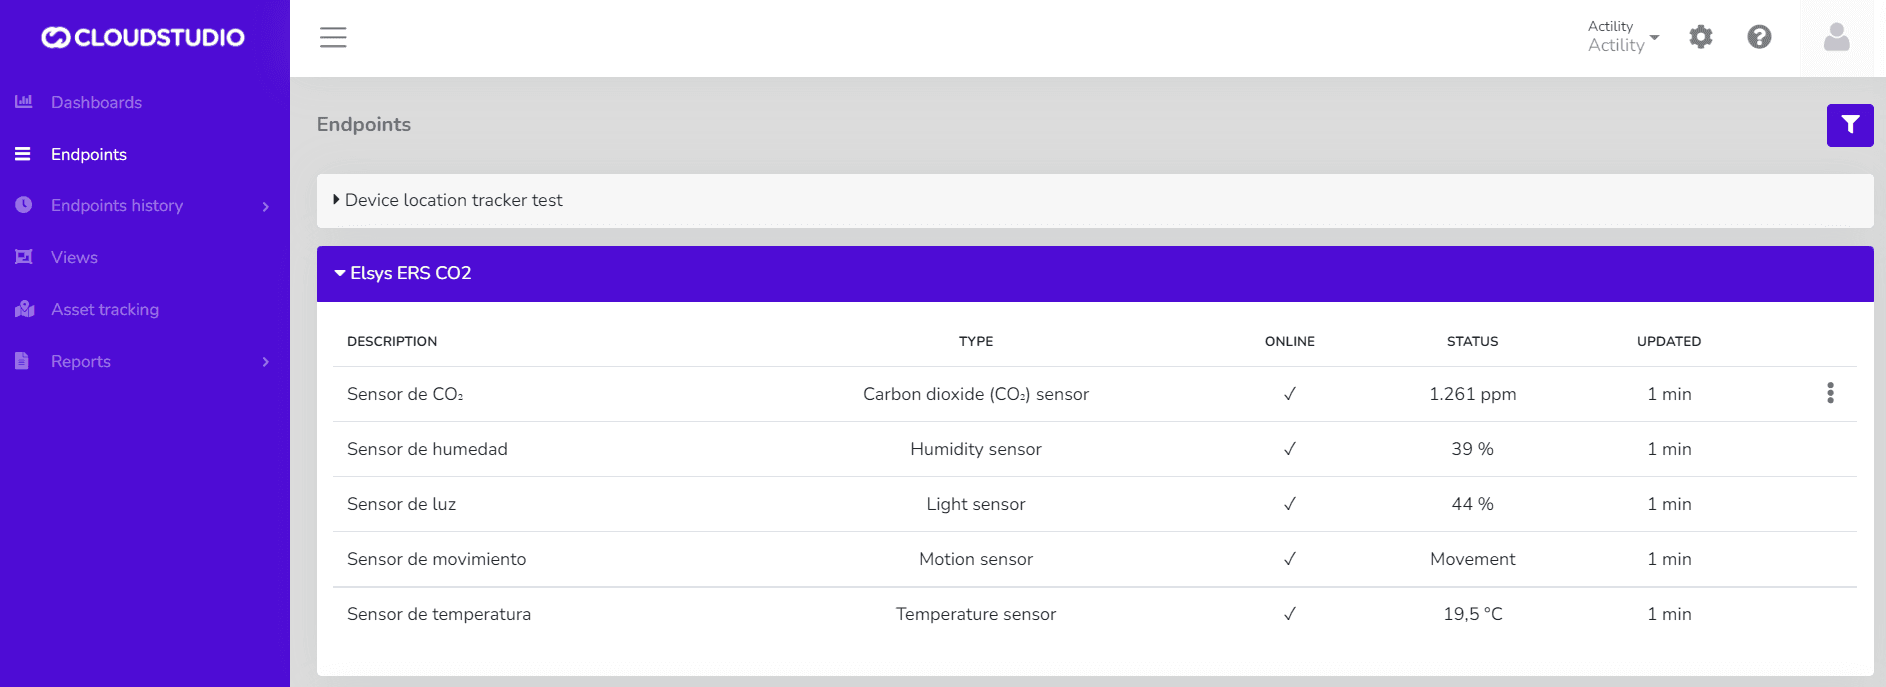
- After the device is created, data reported to the platform will be displayed in the Endpoints section in the left menu of the Monitor. Note that LoRaWAN devices may report every 5 to 15 minutes, so the display will depend on this interval.
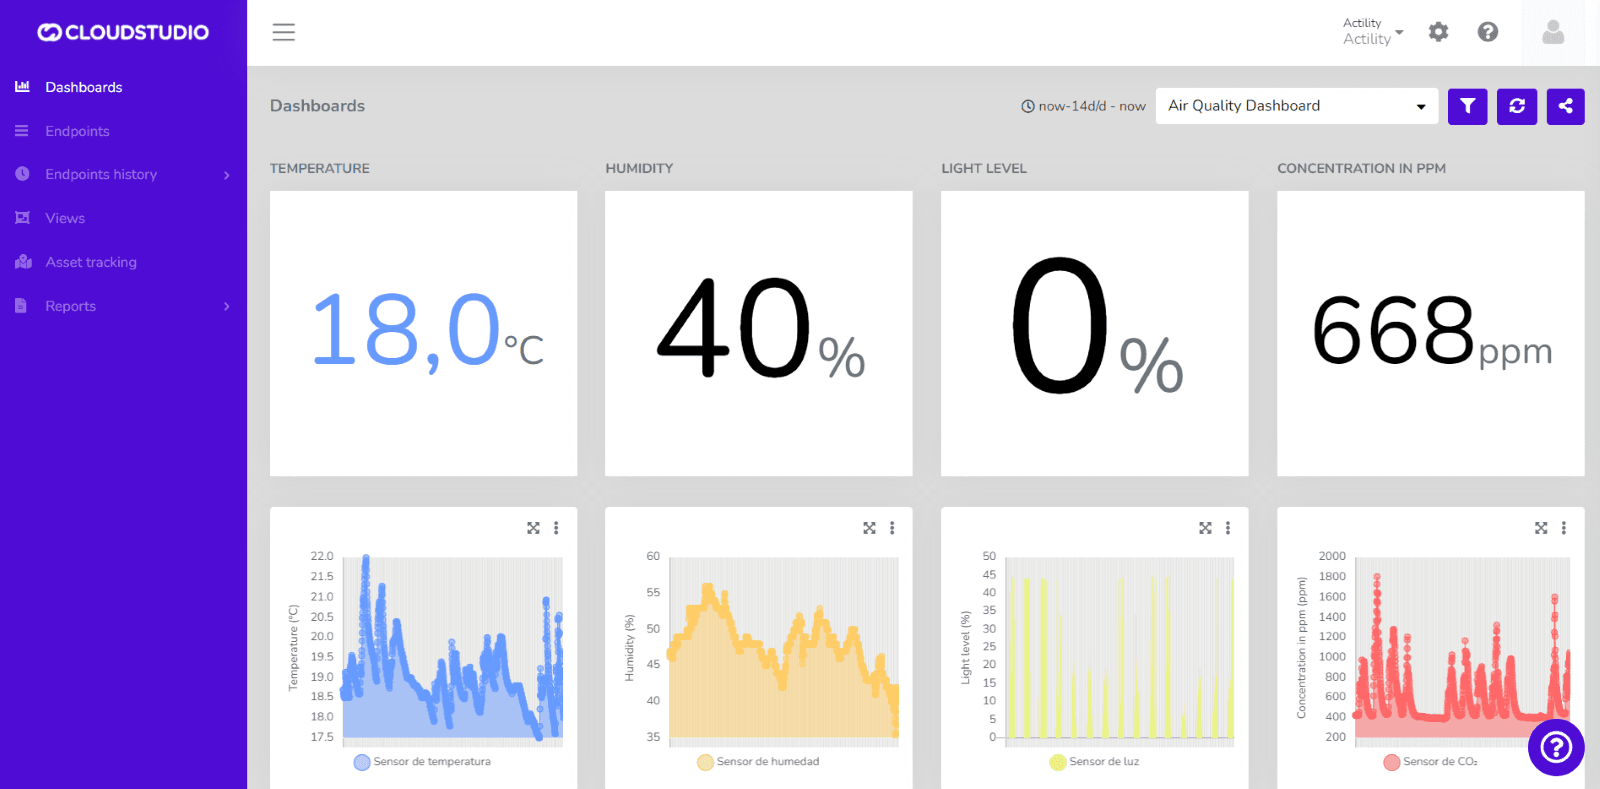
- Once the devices are correctly connected, you can create a custom Dashboard using a wide variety of Widgets to display the data being sent by the device.
Check out our tutorial on YouTube
Last updated on
The Things Stack (TTN / TTS)
The Things Stack integration allows the platform to communicate with LoRaWAN devices using a variety of gateways available on the market. This article describes the steps necessary to complete the integration.
LORIOT
The LORIOT integration enables the platform to have solid communication between a connectivity provider and a quality IoT Platform like Cloud Studio IoT.