Vues
Views allow designing SCADA visualizations where images can be inserted and then overlaid with data that, unlike what can be achieved with dashboards, updates in near real-time.
In views, sensor (endpoint) data from devices is inserted using a WYSIWYG design tool through the use of visual objects called elements.
Views are implemented in two applications:
- The view manager sub-module, which includes the designer and is found in the Manager.
- The visualization sub-module, which allows selecting a running view and is found in the Monitor.
Creating views
To create a new view or modify an existing one, go to the views menu in the Manager application.
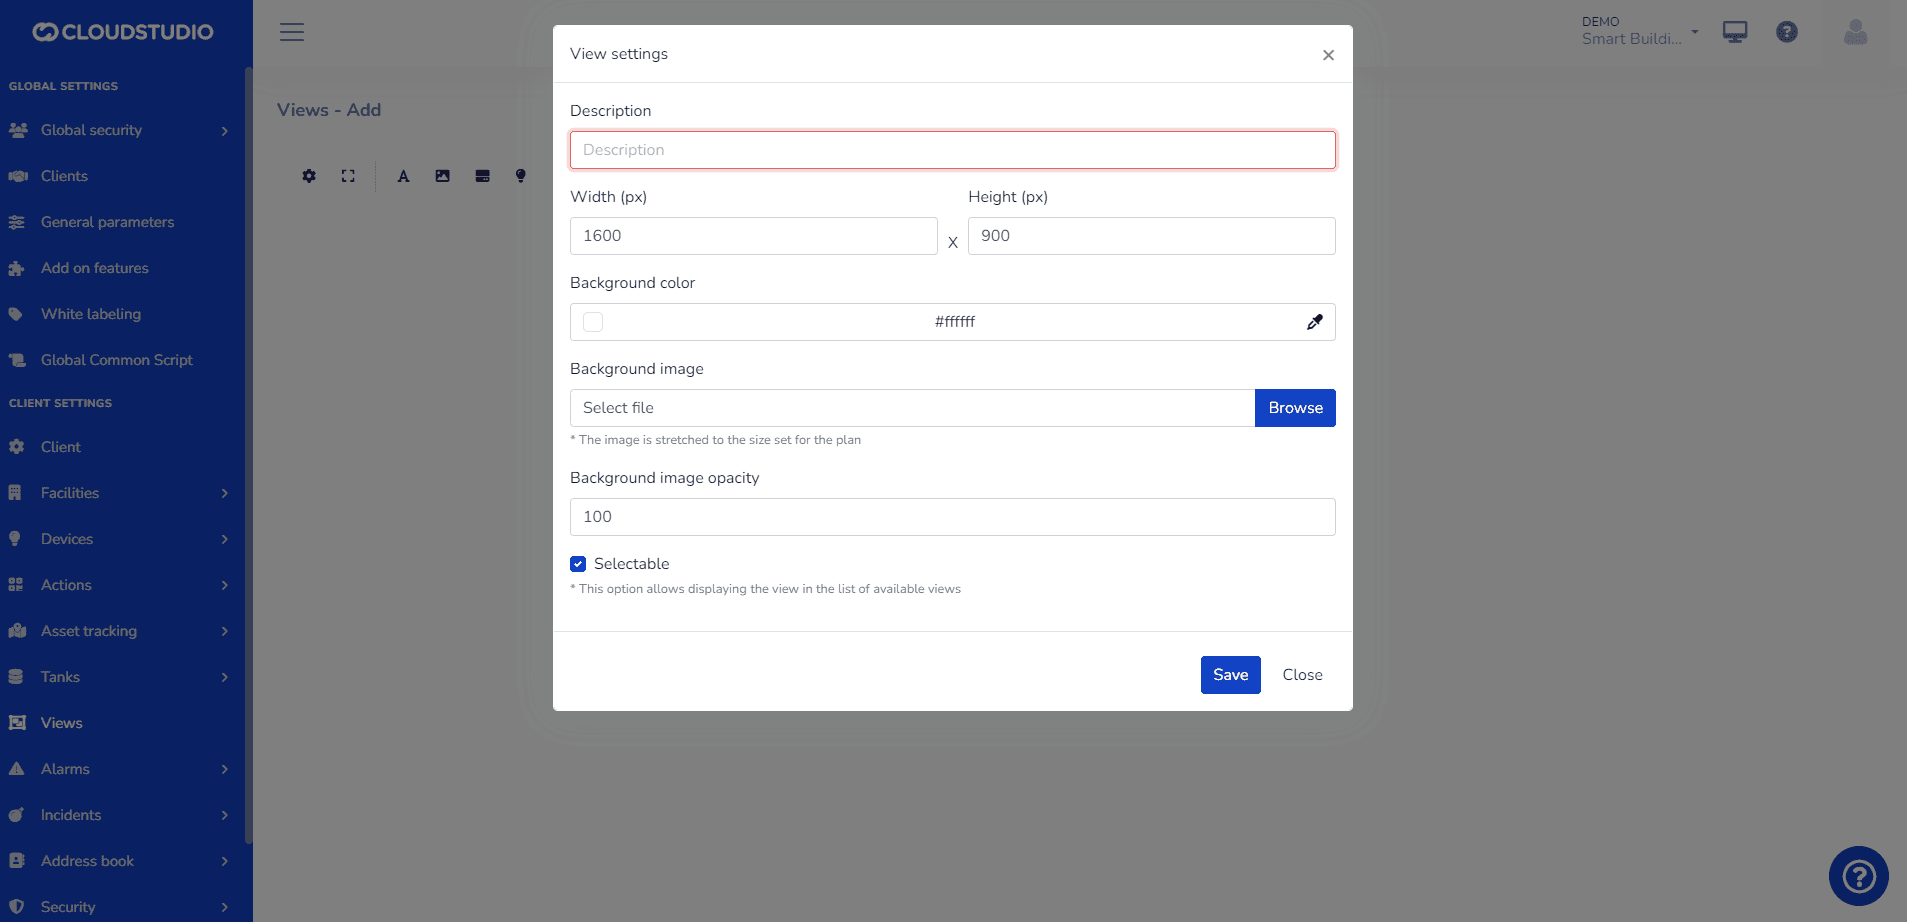
Once created, a canvas with the background chosen by the user will open. In views, the following actions can be performed:
- Add static text elements
- Add static and predefined image elements
- Add real-time endpoint status elements in text format
- Add real-time endpoint status elements with predefined images based on the variable type.
- Add occupancy elements.
- Add alarm elements.
- Add camera-type endpoint snapshots
Tips:
- The recommended size for views is 1600px x 900px. However, it can be customized to the user's needs. - We recommend .PNG format for images with transparent backgrounds. - Watch our video on YouTube to learn more about SCADA-type views.
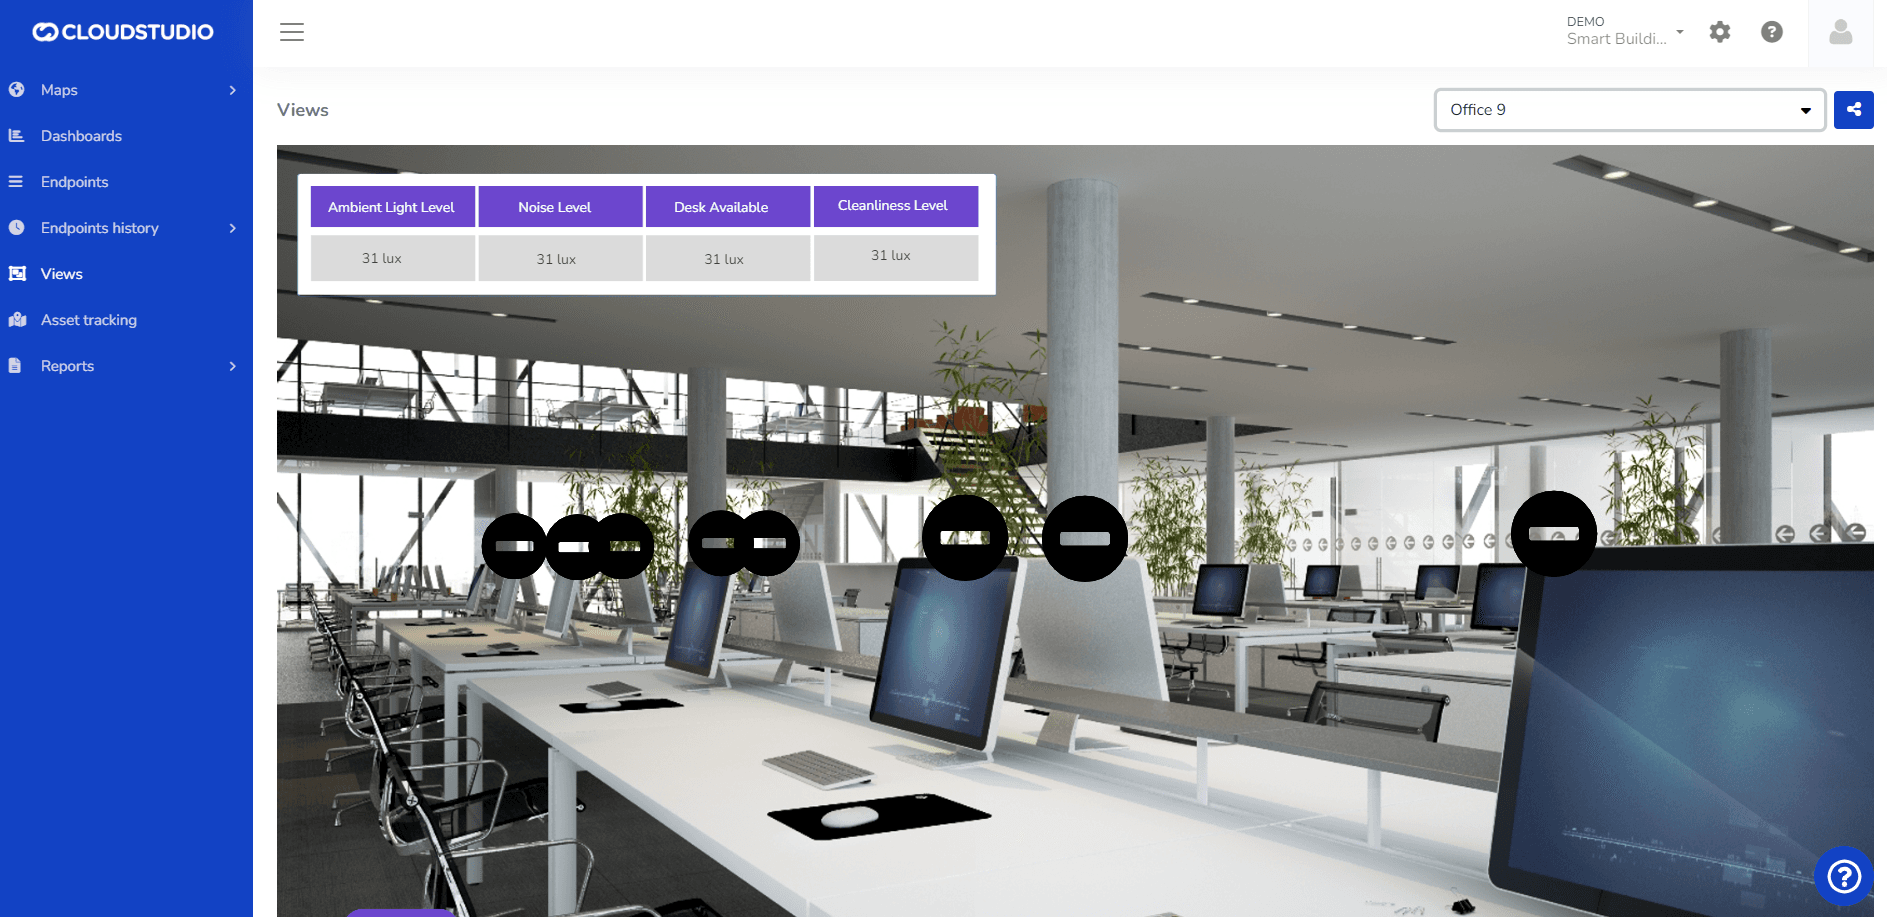
Once the view is configured, the user can view it from the Monitor as shown in the following image:
Métriques
Une métrique est une mesure quantitative utilisée pour évaluer et monitorer la performance d'un système IoT ou d'un appareil en temps réel. Les métriques sont utilisées pour collecter des données qui peuvent être analysées pour obtenir des insights précieux sur le comportement et l'efficacité de l'appareil IoT.
Éléments
Page suivante