

Historique
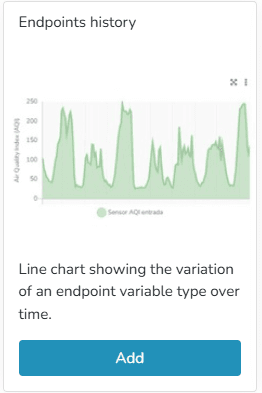
Line chart showing the variation of an endpoint variable type over time. In endpoint history charts, the user can enter minimum and maximum values to define the Y-axis ranges, as well as modify the variable names associated with the Y-axis titles.
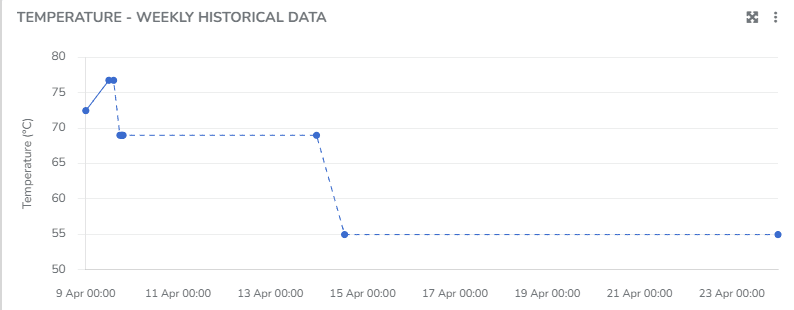
You can view information corresponding to states when the Endpoint was connected, as well as when it was disconnected. You can choose to display the grid line direction, endpoint labels, minimum/maximum/average values, use custom colors, and apply the available filters.
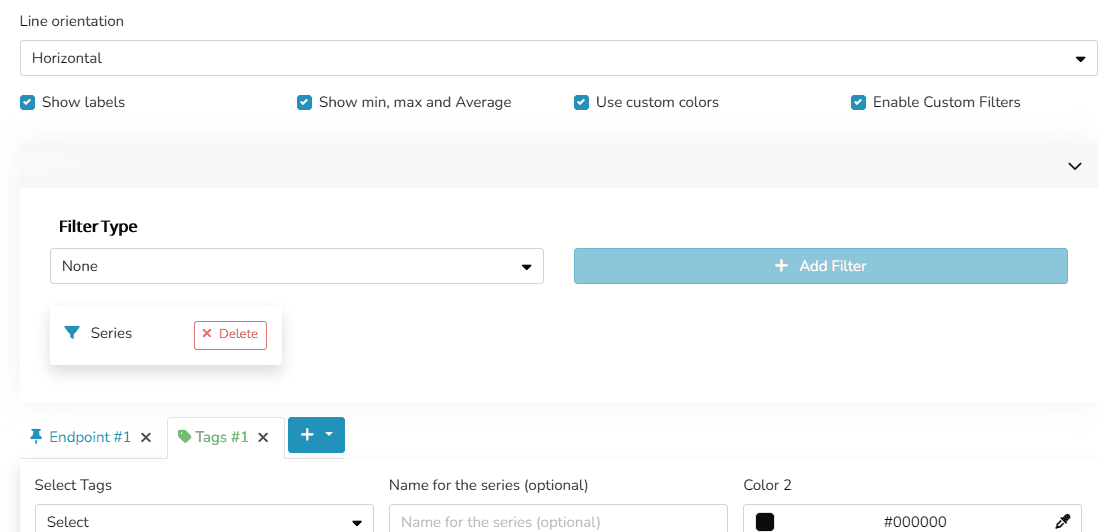
The user can organize the information and visualization of these charts through different criteria within the Widget:
- Grid line orientation: Horizontal/Vertical/Both
- Labels for naming series
- Show or hide Maximum/Minimum/Average values
- Custom colors
- Custom filters
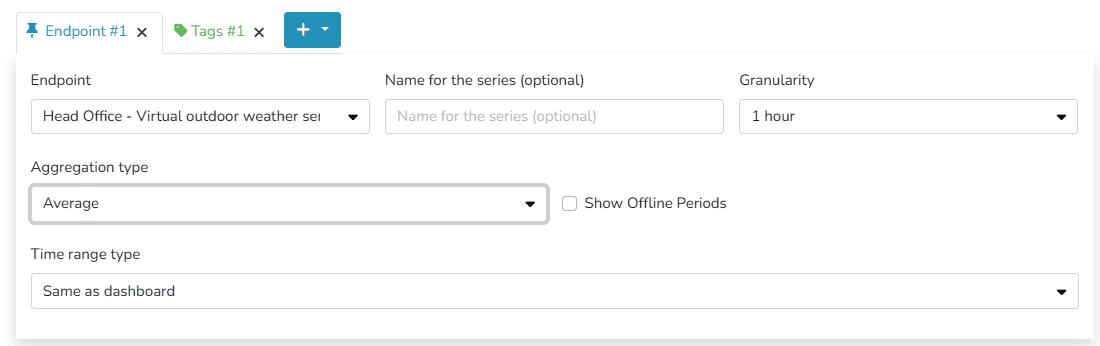
- Granularity
- Aggregation
- Disconnection Time
- Time range: this can match the dashboard's time range or be a different time range, specifying the dates to be viewed in this widget.
You can choose to display information either by identifying one or more endpoints of the same type, or by labels associated with those endpoints.
Additionally, there is an option to define different Comfort Zones within the allowed value ranges for the endpoint.

Dernière mise à jour le
Widget d'appareil
L'utilisateur peut utiliser ce widget pour visualiser des informations pertinentes sur un appareil spécifique, ainsi que les données de jusqu'à 2 de ses endpoints.
Historique - Grille
La plateforme inclut des widgets prédéfinis qui facilitent la présentation des données dans les tableaux de bord. Parmi eux se trouvent les widgets d'historique et d'historique comparatif. Ils permettent de visualiser l'évolution des mesures d'endpoint au fil du temps.