

Widgets avec zone de confort
The Cloud Studio platform features a series of specific widgets for branch monitoring, energy consumption, power history, consumption, weather data, and more, for use in dashboards configurable by the end user.
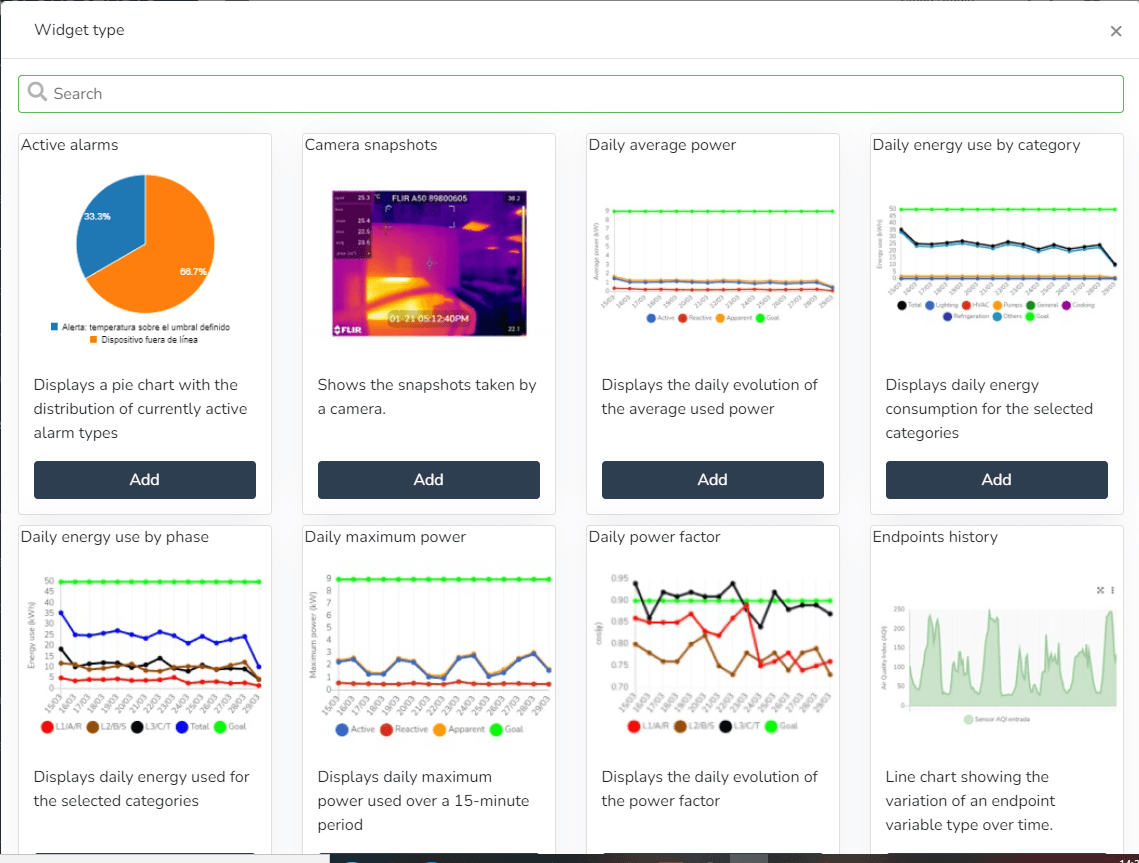
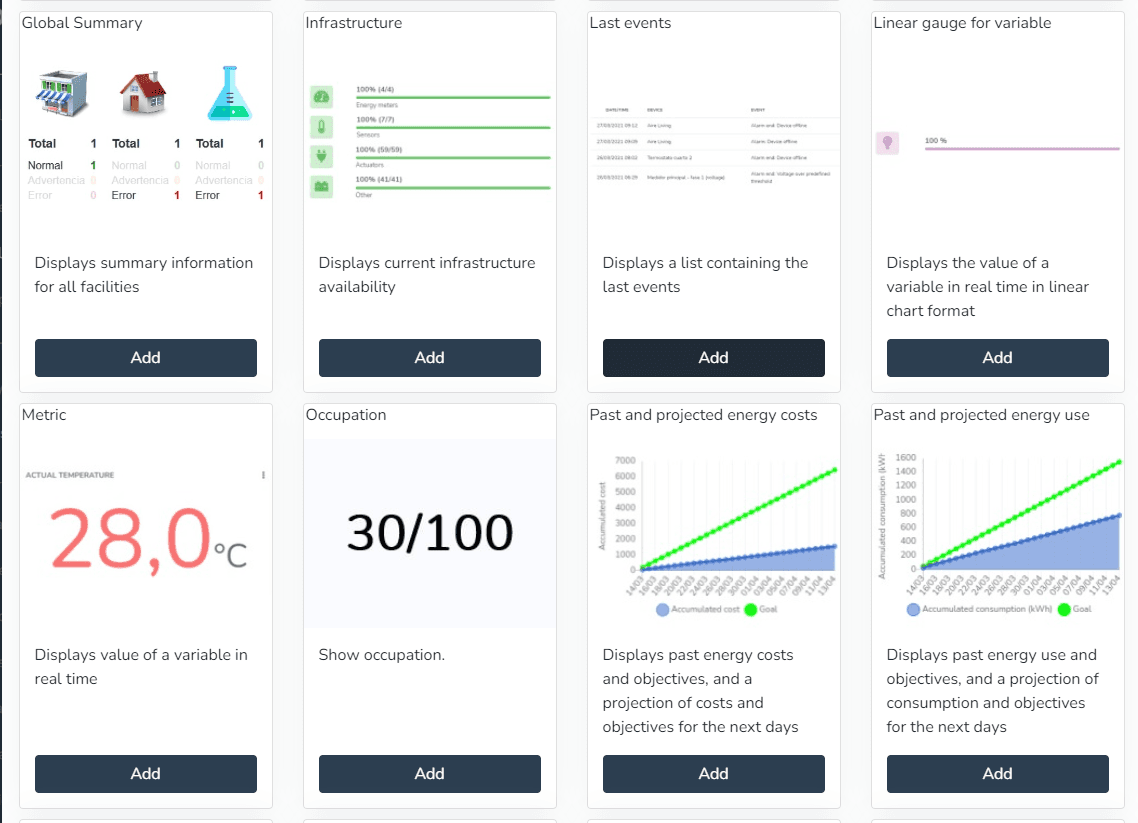
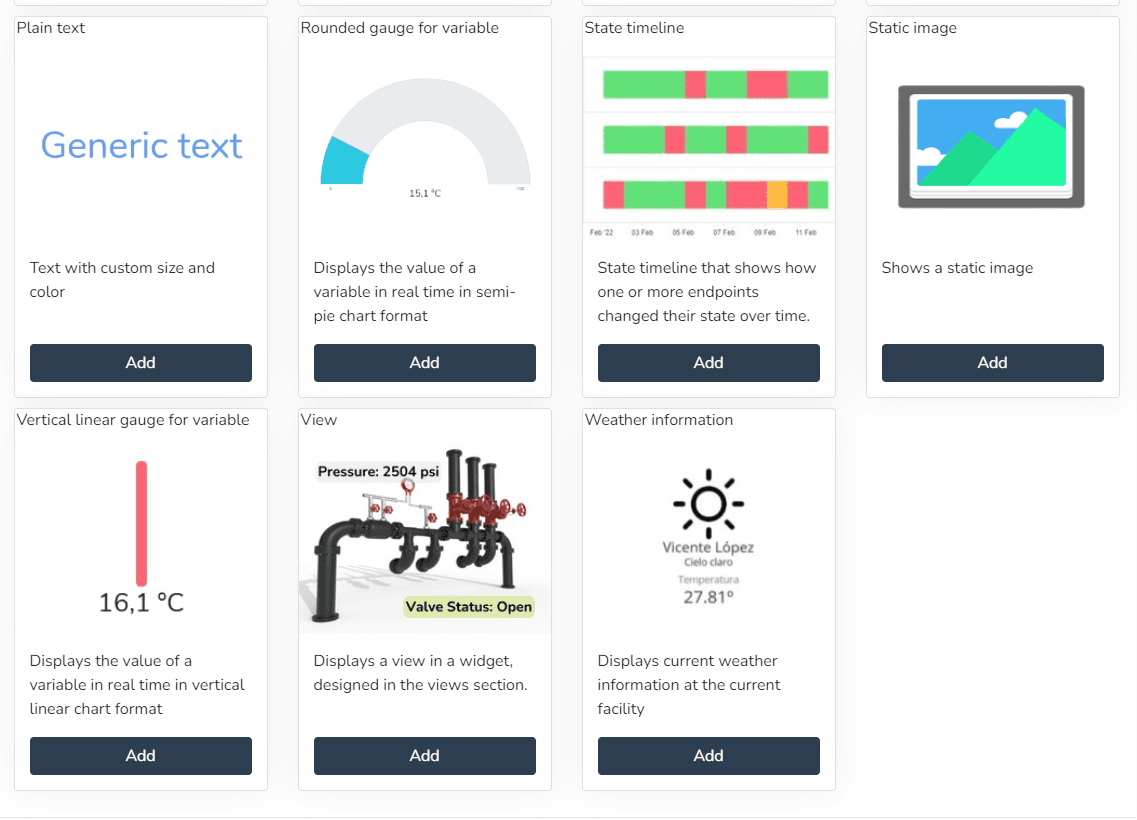
- Active alarms (Displays a pie chart with the distribution of currently active alarm types)
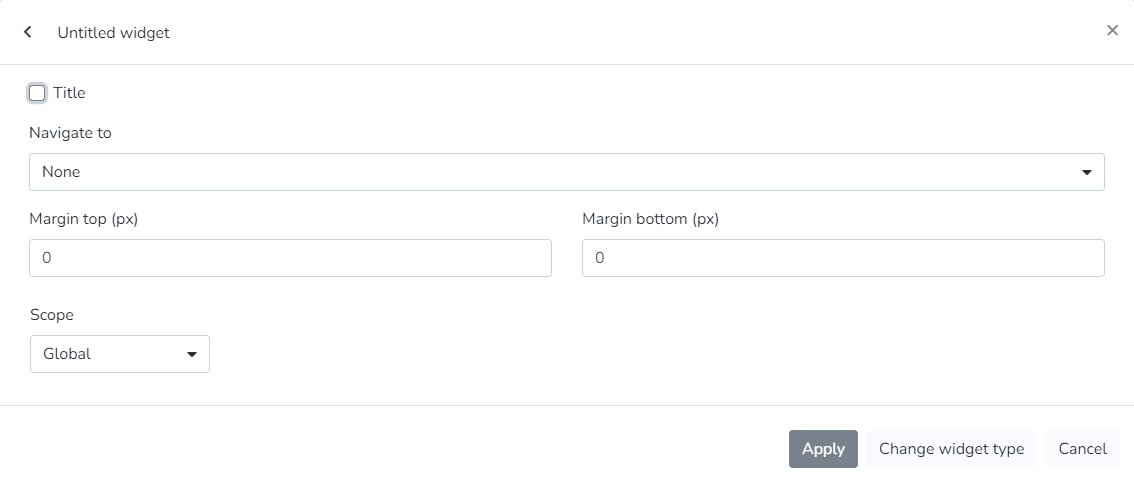
- Past and projected energy consumption (Displays past energy consumption and targets, as well as a projection of consumption and targets for the coming days)
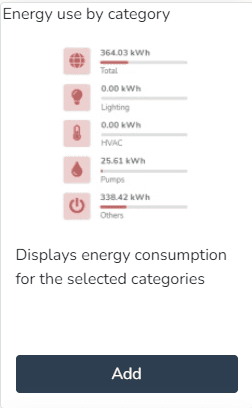
- Energy consumption by category (Displays energy consumption for selected categories)
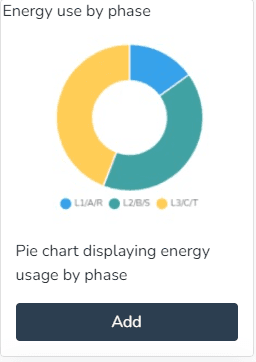
- Energy consumption by phase (Pie chart showing energy consumption by phase)
- Daily energy consumption by category (Displays daily energy consumption for selected categories)
- Daily consumption by phase (Displays daily consumption by phase for selected categories)
- Energy cost by category (Displays energy cost for selected categories)
- Past and projected energy costs (Displays past energy costs and targets, as well as a projection of costs and targets for the coming days)
- Weather status (Displays the weather status at the current facility)
- Daily power factor (Displays the daily evolution of the power factor)
- Infrastructure (Displays the current availability of the infrastructure)
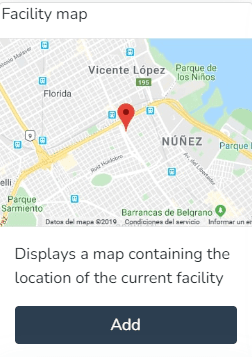
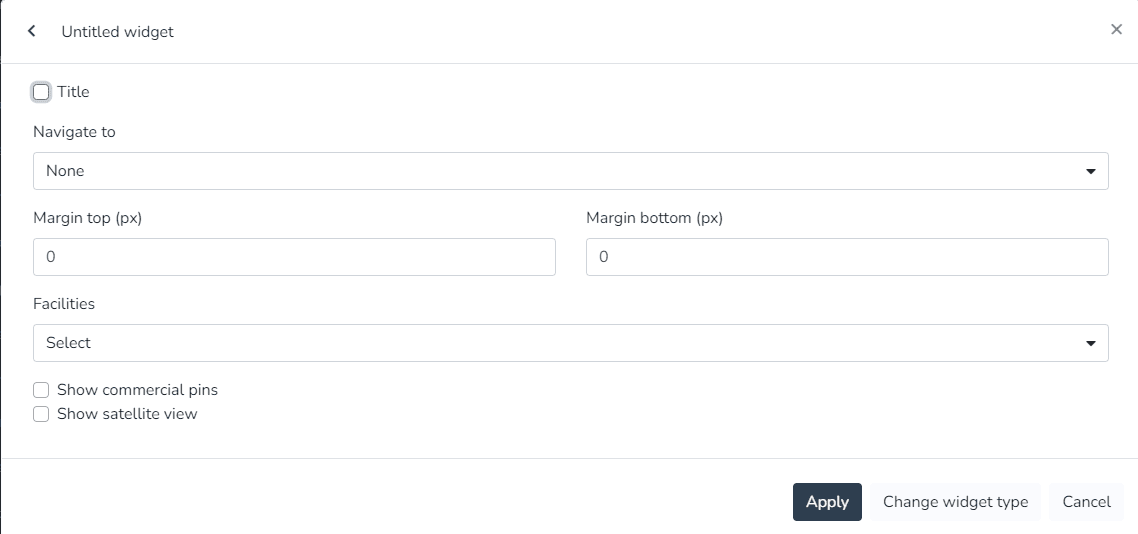
- Facility map (Displays a map containing the location of the current facility)
- Energy consumption targets (Displays energy consumption information relative to defined targets)
- Daily maximum power (Displays the maximum daily power used in a 15-minute period)
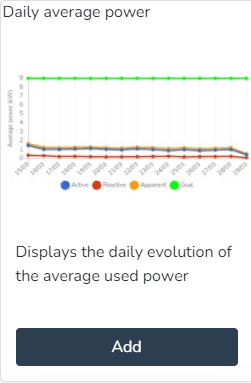
- Daily average power (Displays the daily evolution of the power used)
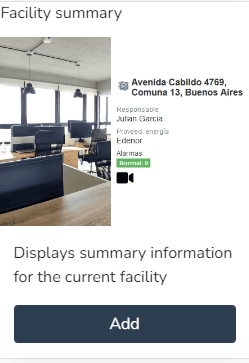
- Facility summary (Displays summary information for the current facility)
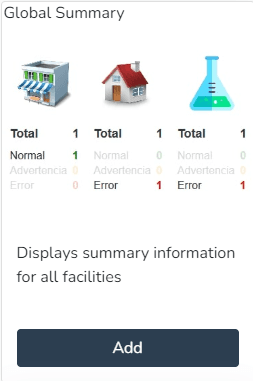
- Global summary (Displays summary information for all facilities)
- Latest events (Displays a list with the latest events)
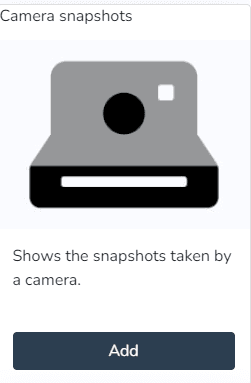
- Camera snapshots (Displays snapshots taken by a camera)
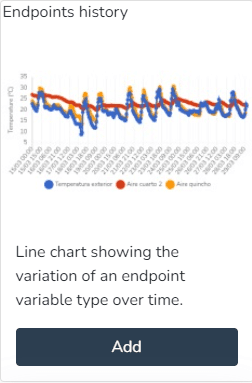
- Endpoint history (Line chart showing the variation of an endpoint variable type over time)
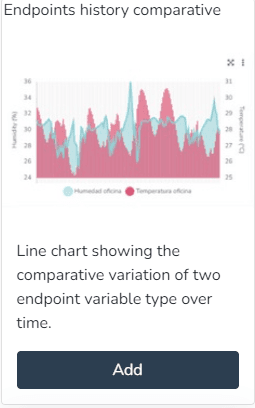
- Comparative endpoint history (Line chart showing the comparative variation of two endpoint variable types over time)
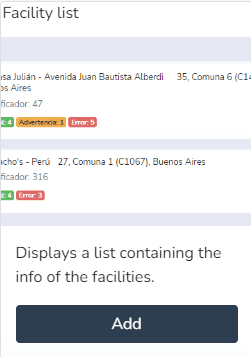
- Facility list (Displays a list containing facility information)
- World summary (Displays summary information for all facilities)
- Infrastructure (Displays the current availability of the infrastructure)
- Latest events (Displays a list containing the latest items)
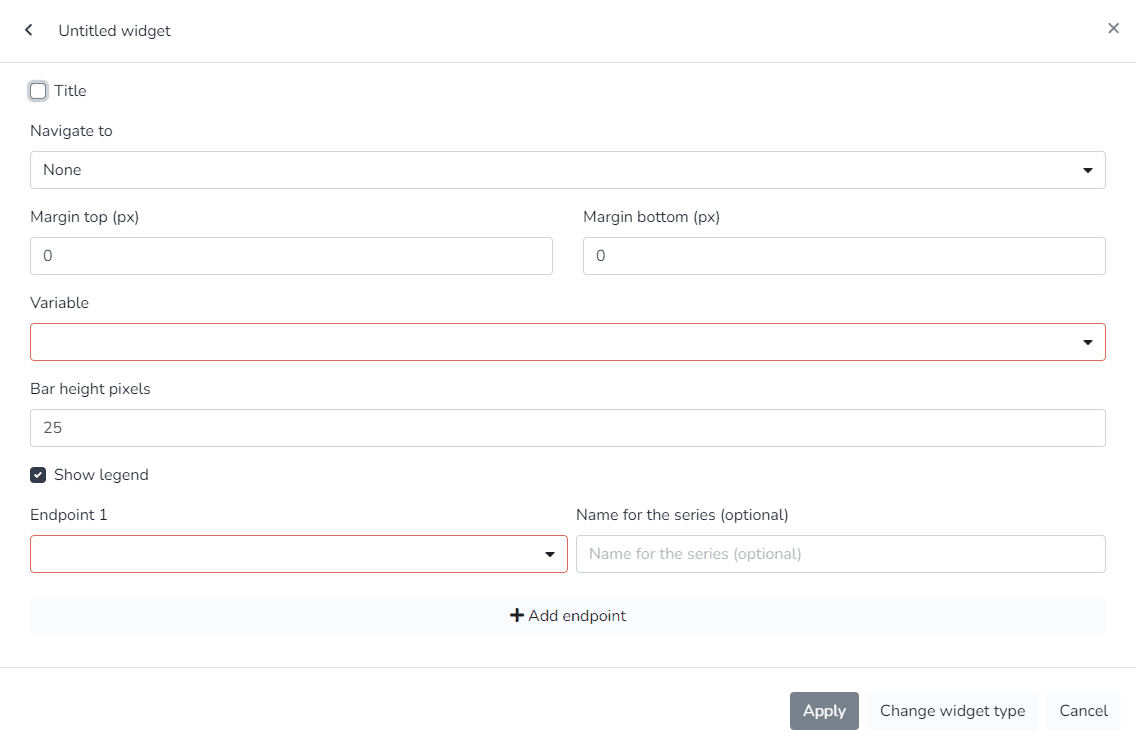
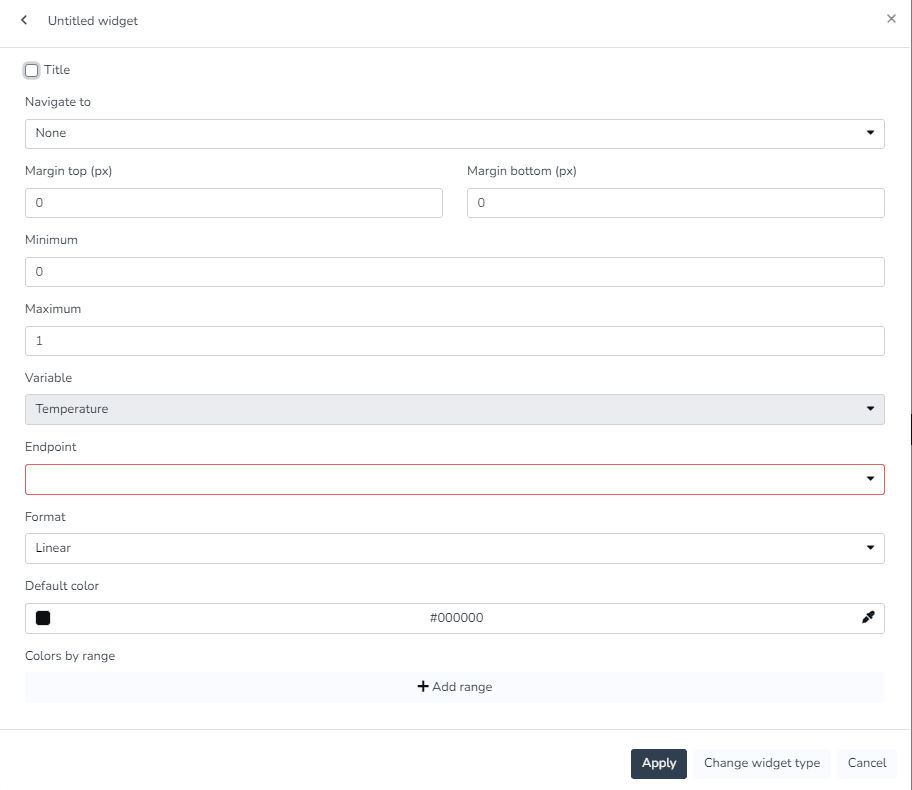
- Linear gauge for variable (Displays the value of a variable in real time as a linear chart)
- Metric (Displays the value of a variable in real time)
- Occupancy (Displays the occupancy)
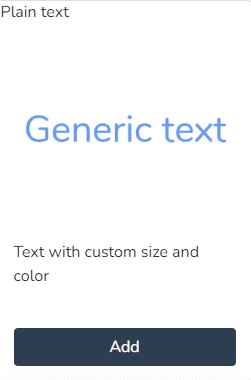
- Plain text (Displays text with custom colors and formatting)
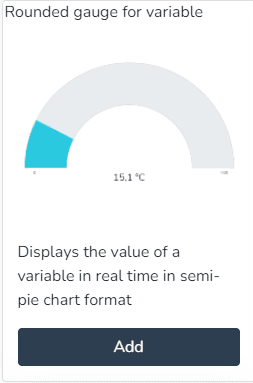
- Rounded gauge for variable (Displays the value of a variable in real time as a semicircular chart)
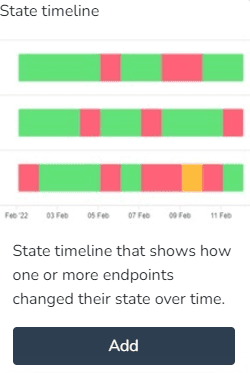
- State timeline (State timeline showing how one or more endpoints changed their state over time.)
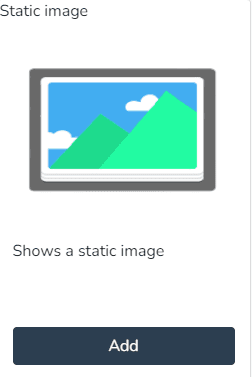
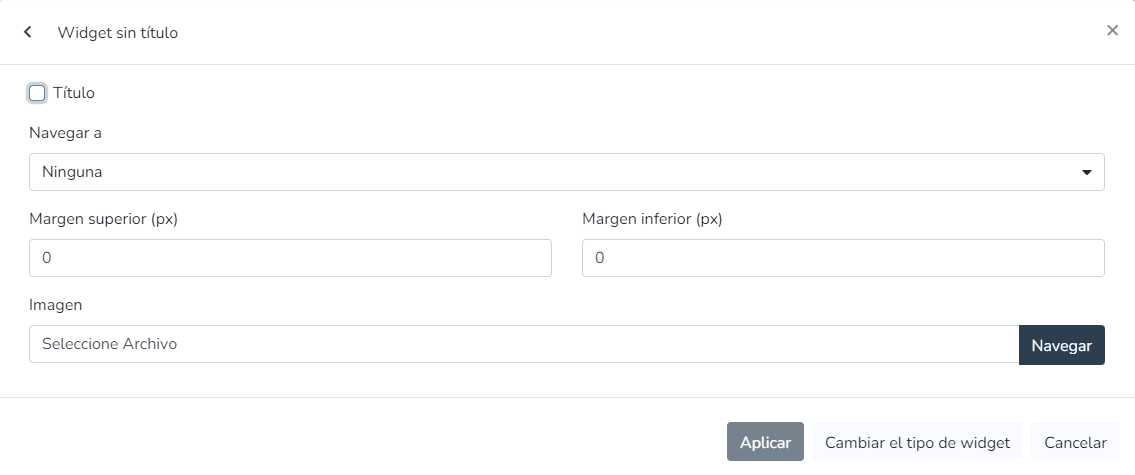
- Static image (Displays a static image)
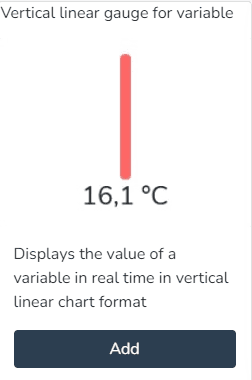
- Vertical linear indicator for variable (Displays the value of a variable in real time as a vertical linear chart)
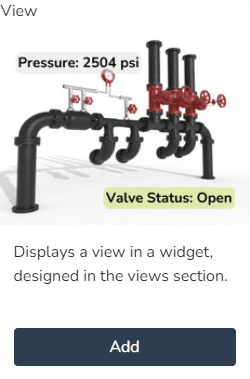
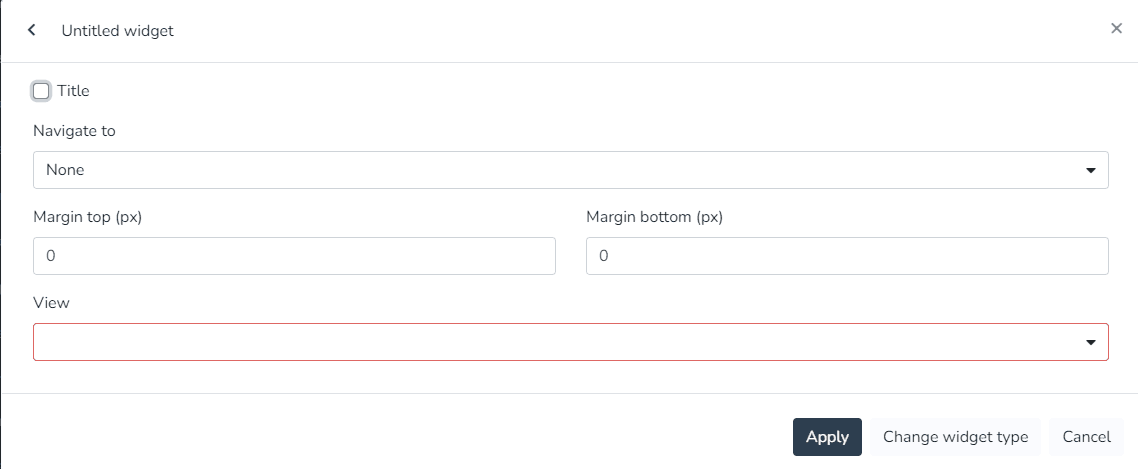
- View (Displays a view in a widget, designed in the views section)
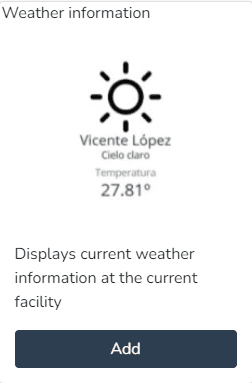
- Weather information (Displays the current weather information at the current facility)
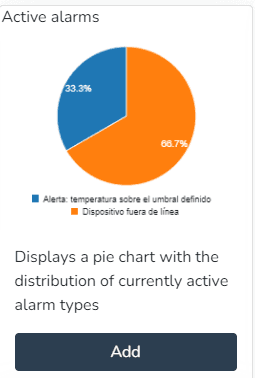
Active Alarms:
The user can use this Widget to create a pie chart with the distribution of currently active alarm types.
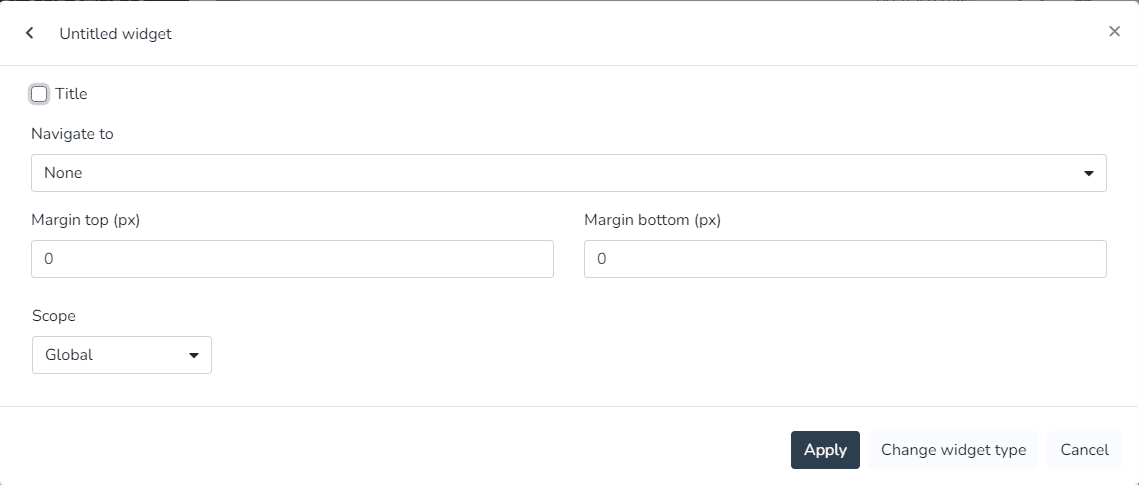
Camera Snapshots:
The user can use this Widget to view snapshots taken by a camera.
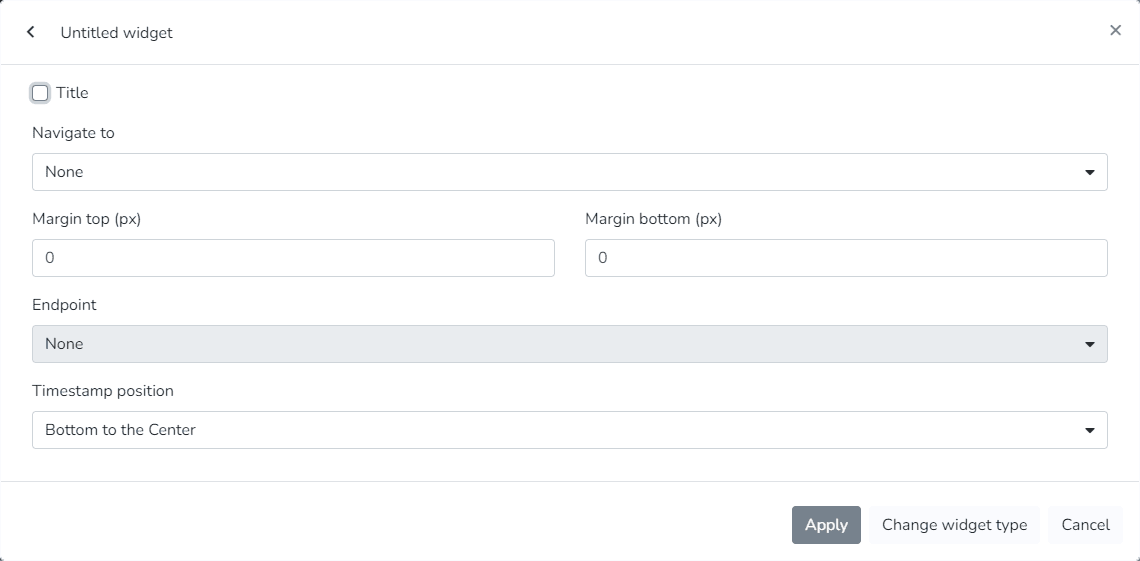
Daily Average Power:
The user can use this Widget to view the daily evolution of the power used.
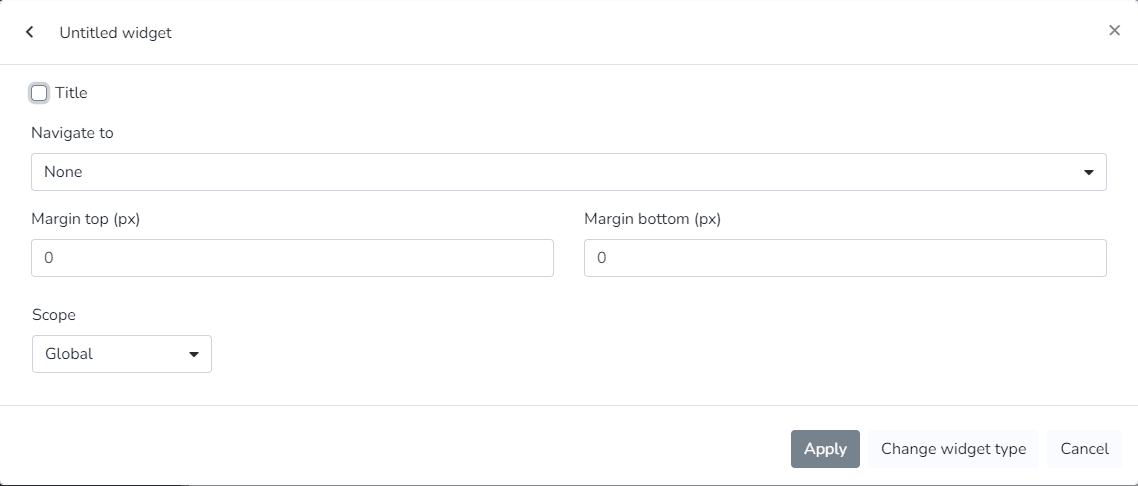
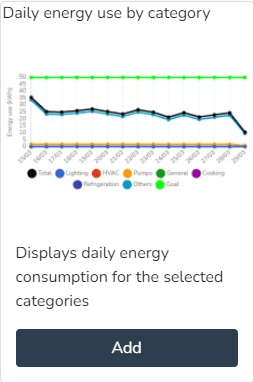
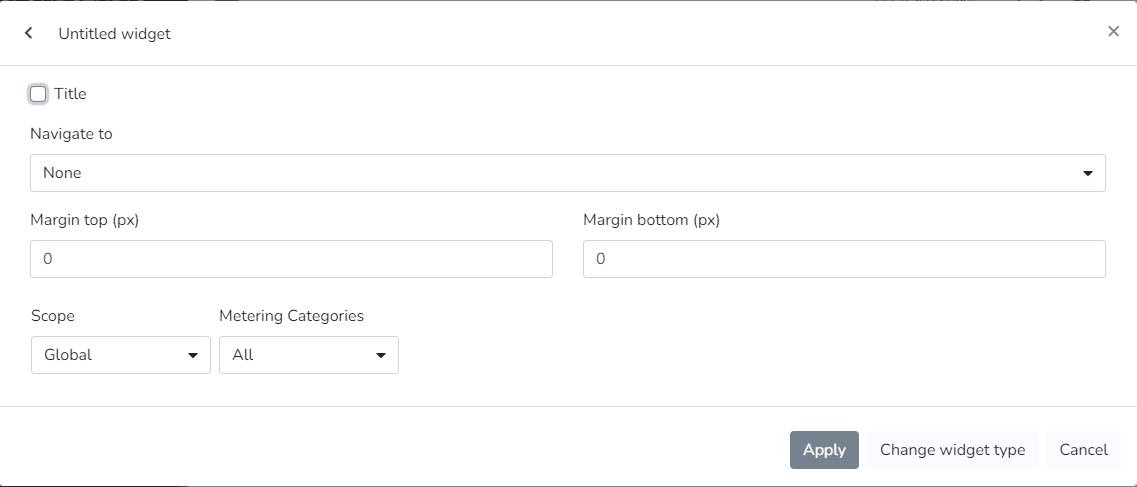
Daily Energy Consumption by Category:
The user can use this Widget to view the daily energy consumption for selected categories.
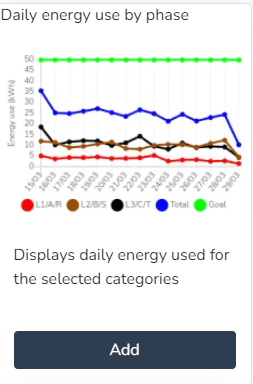
Daily Energy Consumption by Phase:
The user can use this Widget to view the daily energy used for selected categories.
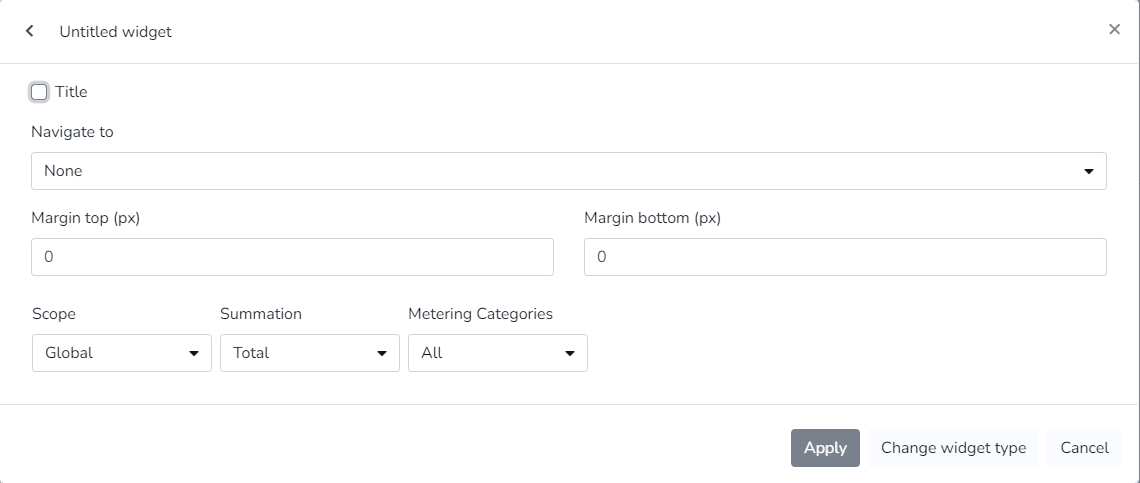
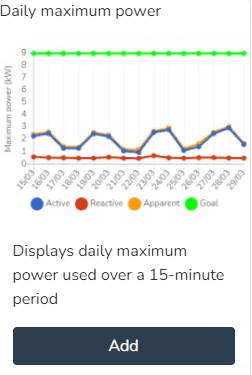
Daily Maximum Power:
The user can use this Widget to view the maximum daily power used in a 15-minute period.
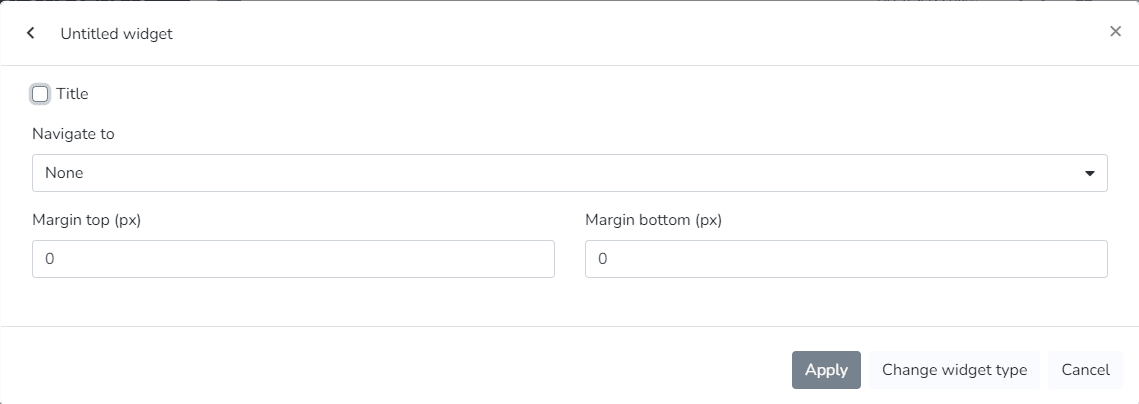
Daily Power Factor:
The user can use this Widget to view the daily evolution of the power factor.
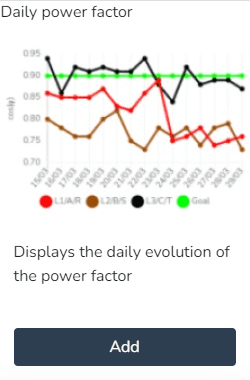
Daily Power Factor:
The user can use this Widget to view the daily evolution of the power factor.
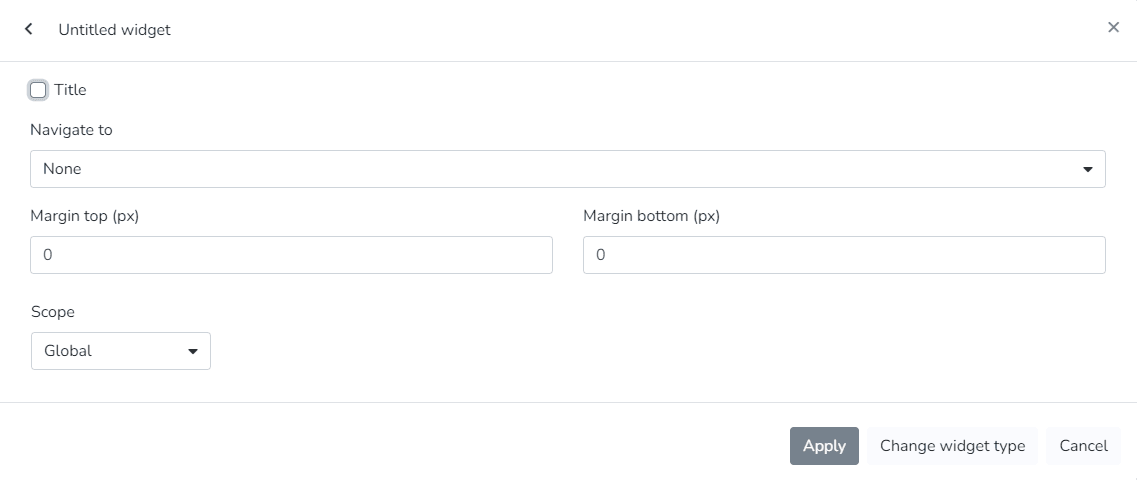
Endpoint History:
The user can use this Widget to generate a line chart showing the variation of an endpoint variable type over time.
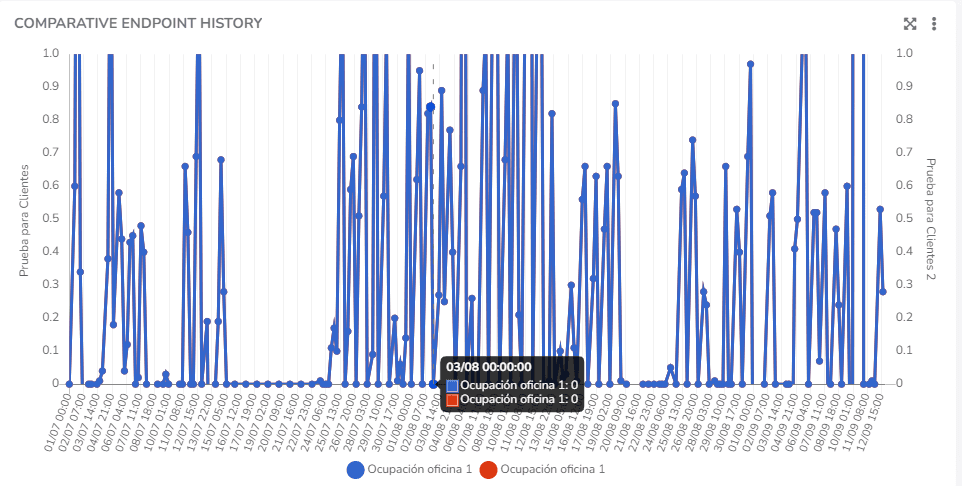
Comparative Endpoint History:
The user can use this Widget to generate a line chart showing the comparative variation of two endpoint variable types over time.
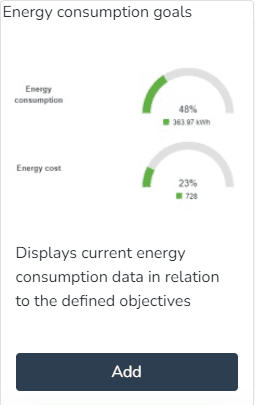
Energy Consumption Targets:
The user can use this Widget to view current energy consumption data relative to defined targets.
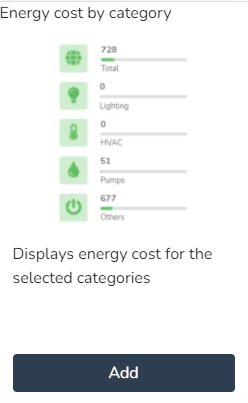
Energy Consumption Targets:
The user can use this Widget to view the energy cost for selected categories.
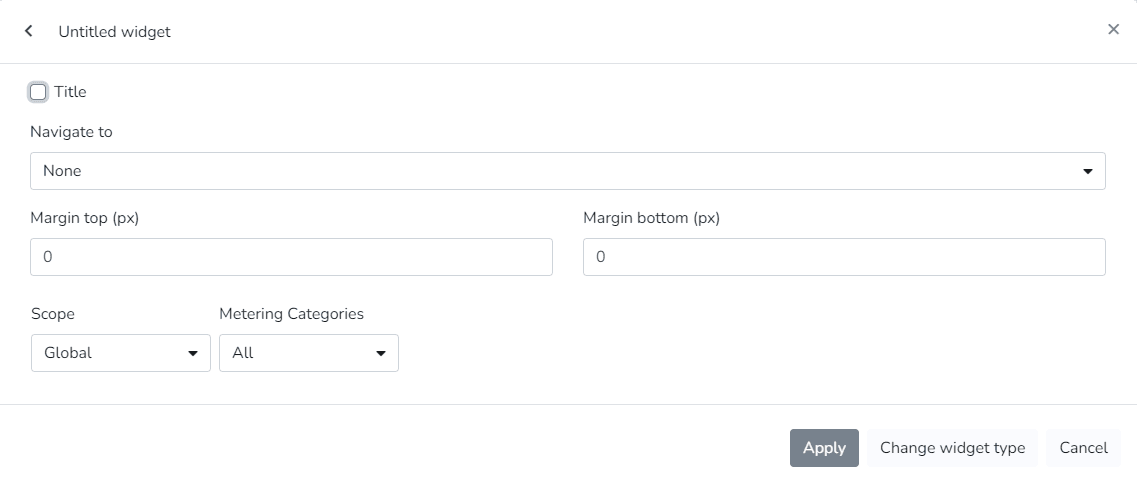
Energy Consumption by Category:
The user can use this Widget to view energy consumption for selected categories.
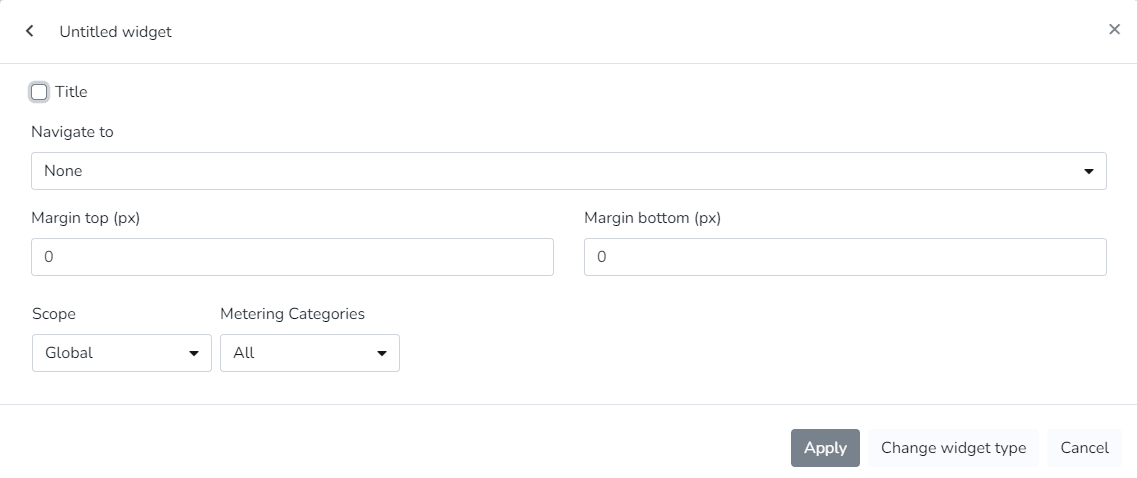
Energy Consumption by Phase:
The user can use this Widget to view a pie chart showing energy usage by phase.
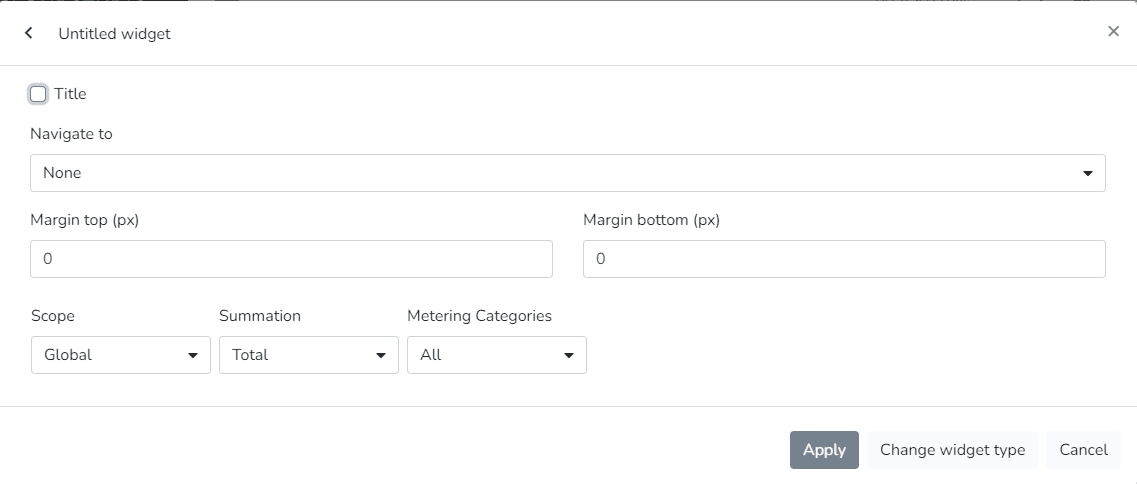
Energy Consumption by Phase:
The user can use this Widget to view a list containing facility information.
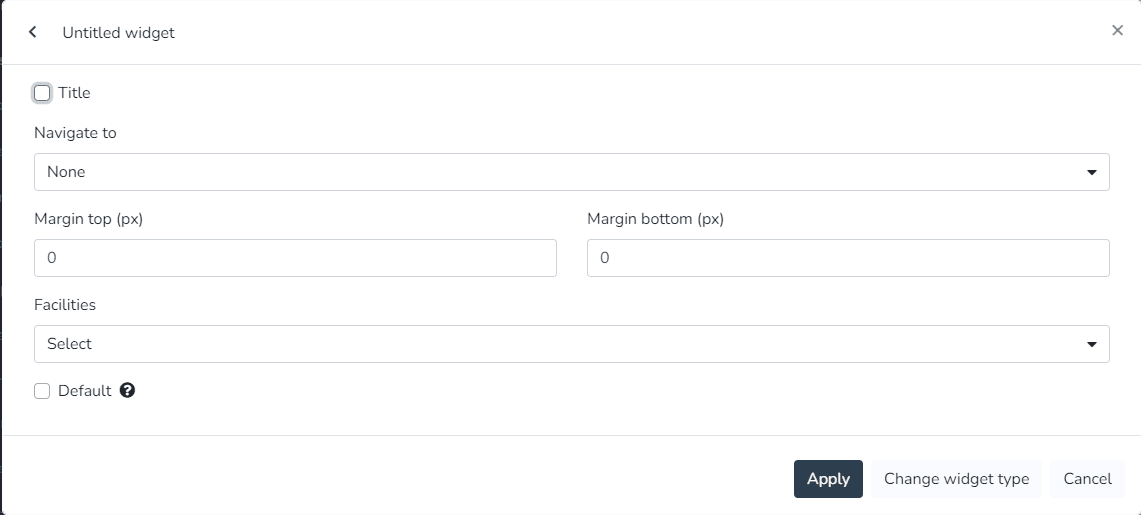
Facility Map:
The user can use this Widget to view a map containing the location of the current facility.
Facility Summary:
The user can use this Widget to view summary information for the current facility.
World Summary:
The user can use this Widget to view summary information for all facilities.
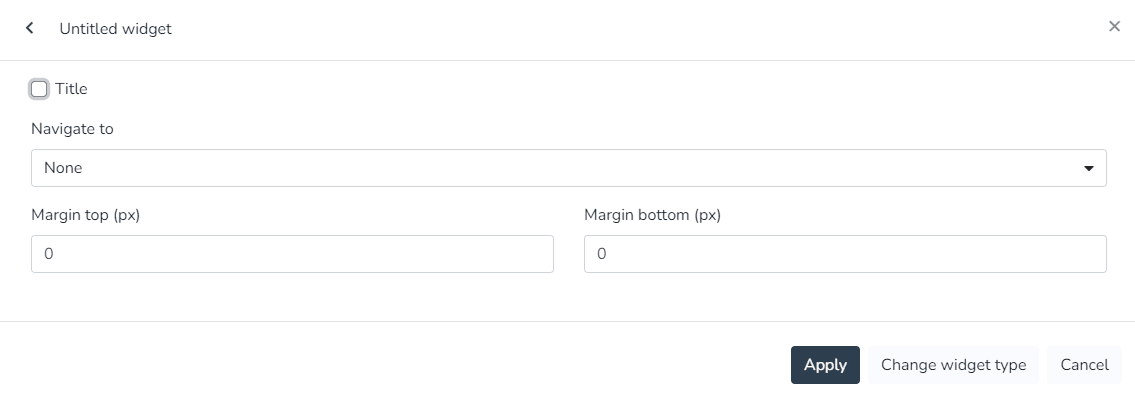
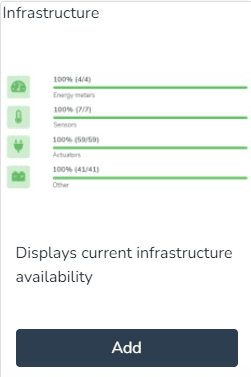
Infrastructure:
The user can use this Widget to view the current availability of the infrastructure.
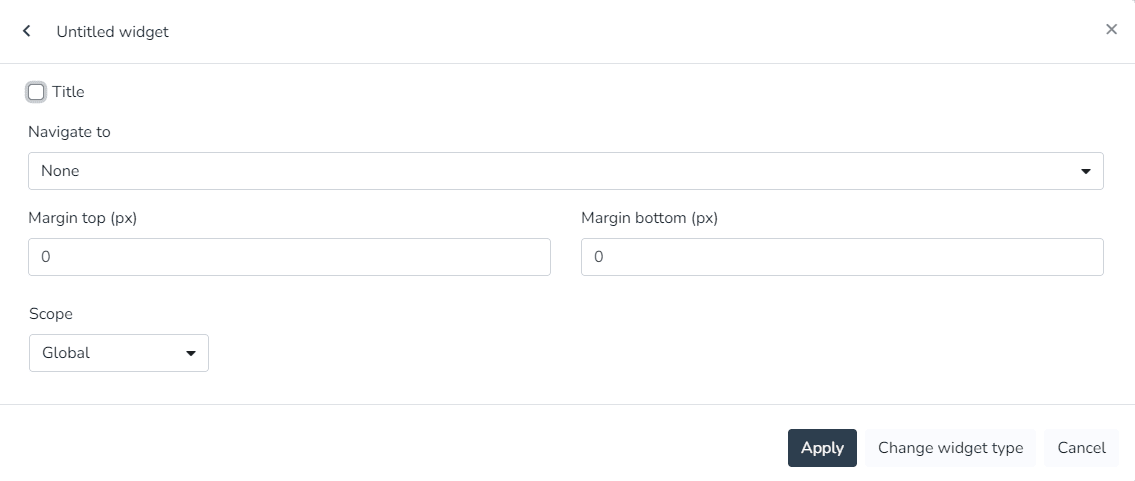
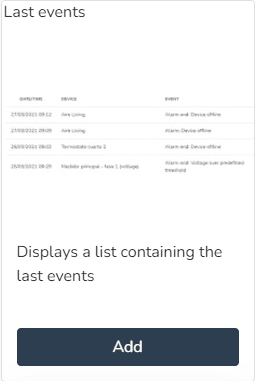
Latest Events:
The user can use this Widget to view a list containing the latest events.
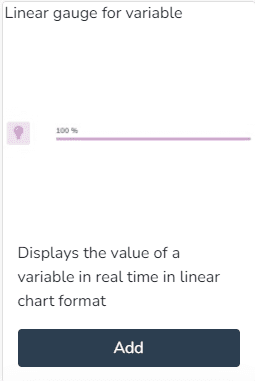
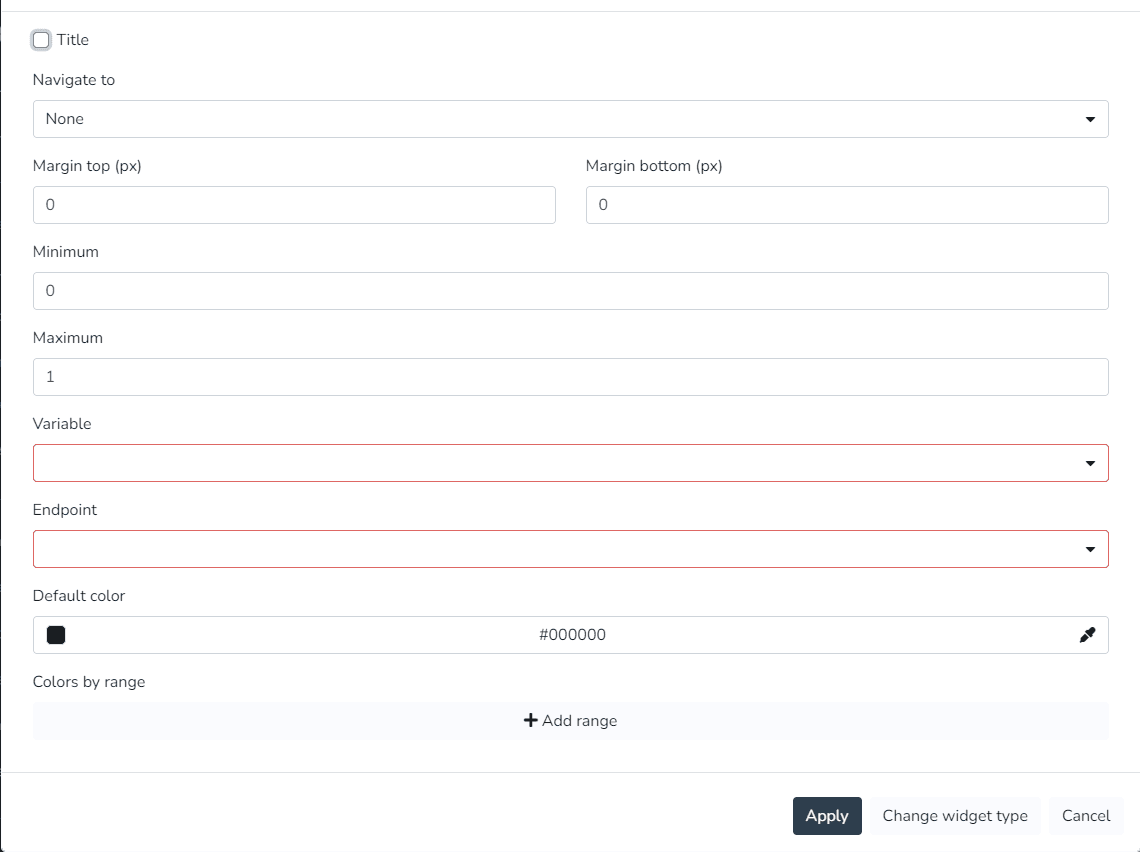
Linear Gauge for Variable:
The user can use this Widget to view the value of a variable in real time as a linear chart.
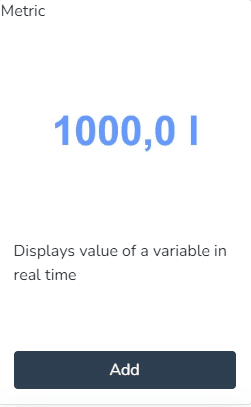
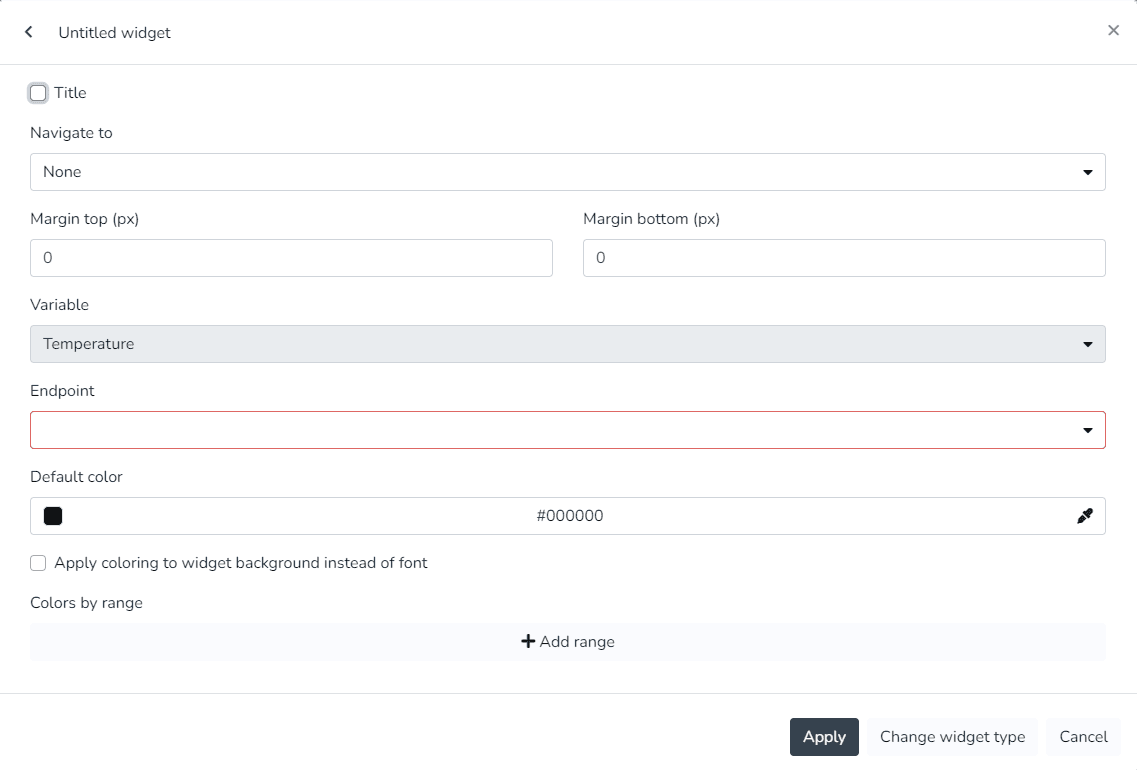
Metric:
The user can use this Widget to view the value of a variable in real time.
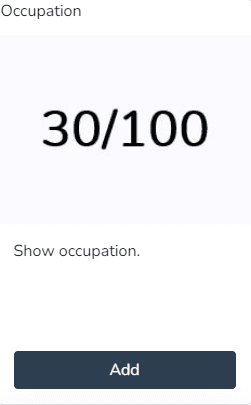
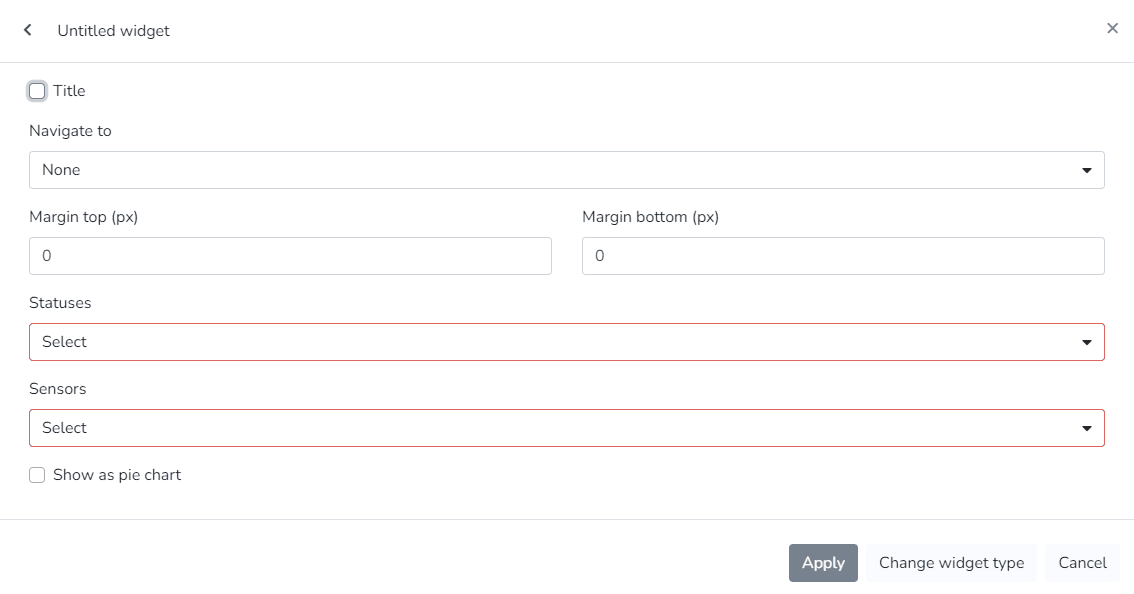
Occupancy:
The user can use this Widget to view the occupancy.
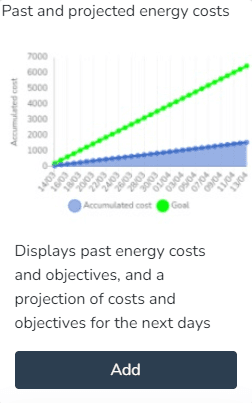
Past and Projected Energy Costs:
The user can use this Widget to view past energy costs and targets, and a projection of costs and targets for the coming days.
Past and Projected Energy Consumption:
The user can use this Widget to view past energy consumption and targets, and a projection of consumption and targets for the coming days.
Plain Text:
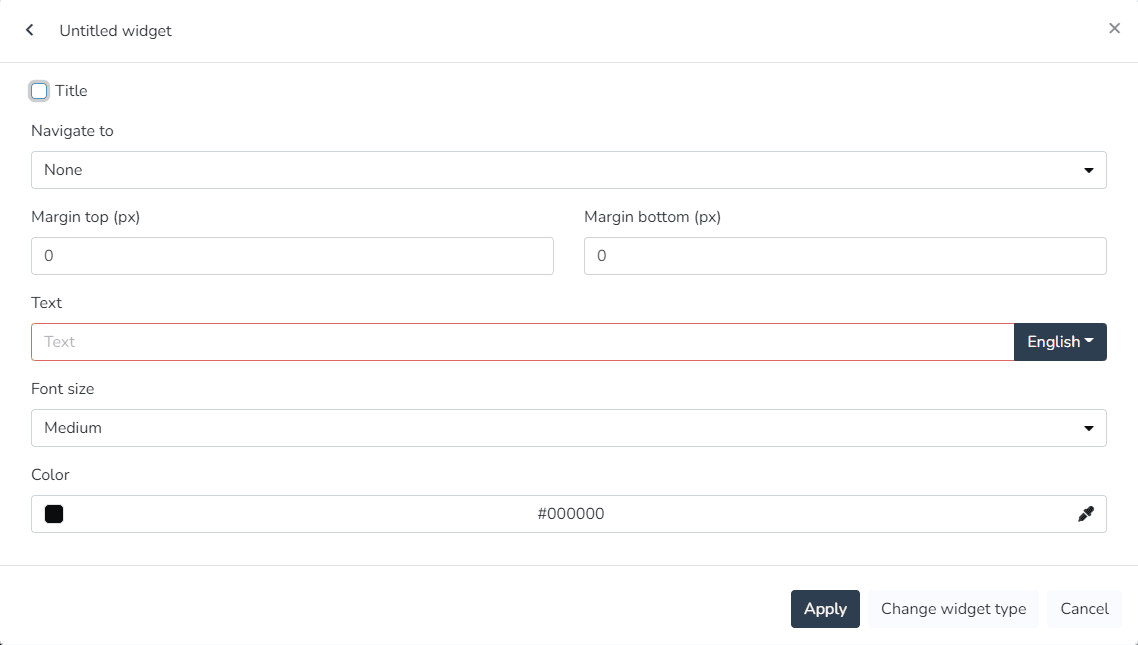
The user can use this Widget to enter text with custom colors and sizes.
Rounded Gauge for Variable:
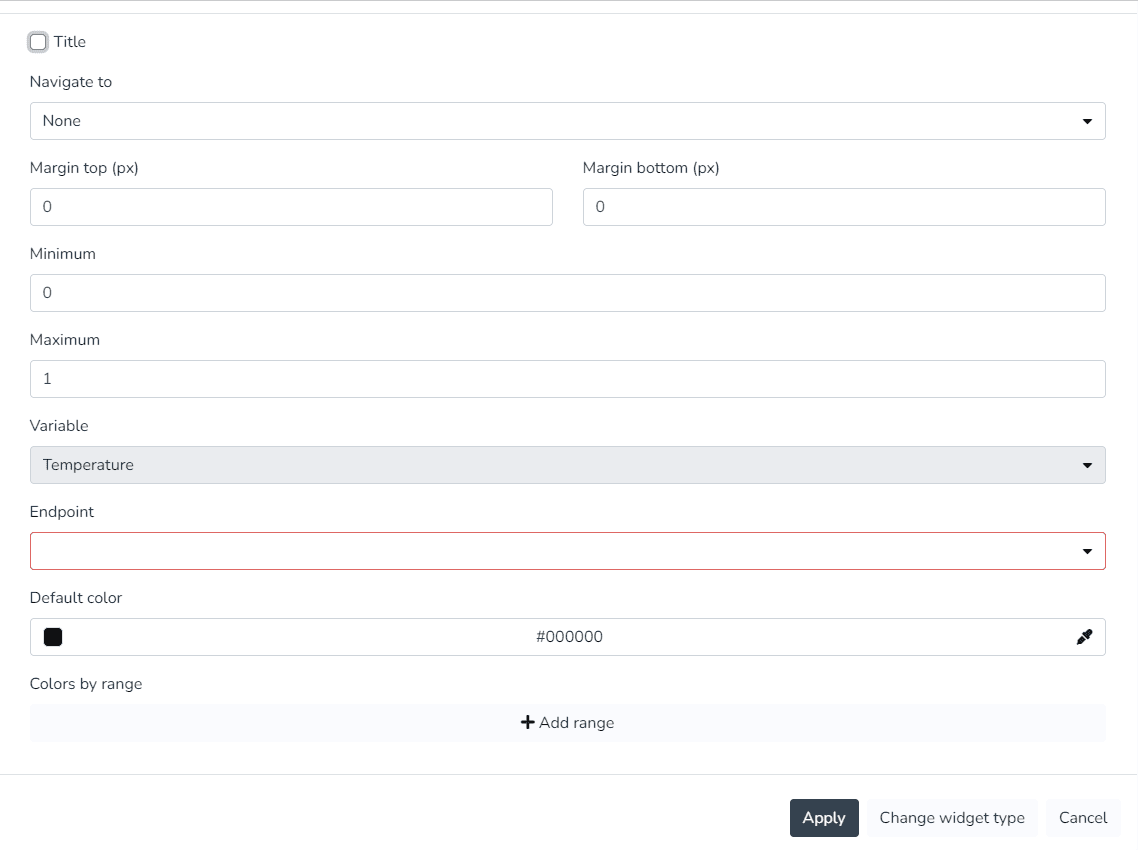
The user can use this Widget to view the value of a variable in real time as a semicircular chart.
State Timeline:
The user can use this Widget to view a state timeline showing how one or more endpoints changed their state over time.
Static Image:
The user can use this Widget to view a static image.
Vertical Linear Indicator for Variable:
The user can use this Widget to view the value of a variable in real time as a vertical linear chart.
Views:
The user can use this Widget to view a view in a widget, designed in the views section.
Weather Information:
The user can use this Widget to view the current weather information at the current facility.
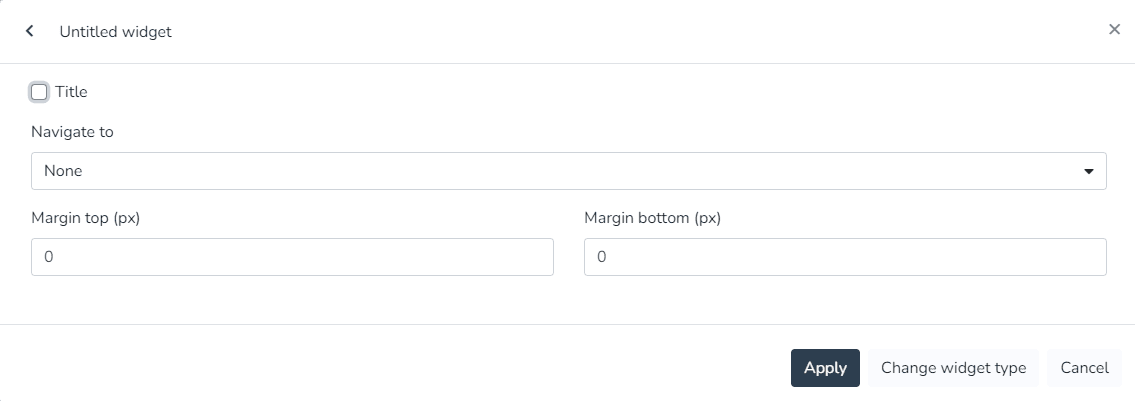
Dashboard Widgets (Monitor)
In the monitor, the dashboard can be configured to the client's needs using any combination of the available widgets:
Endpoint History Widget:
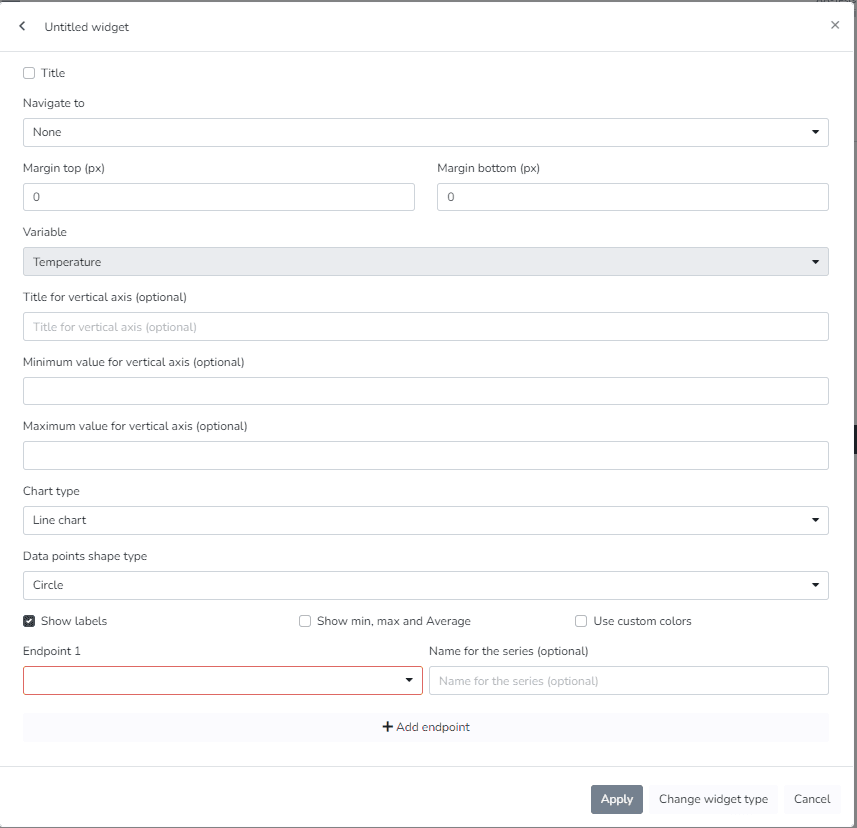
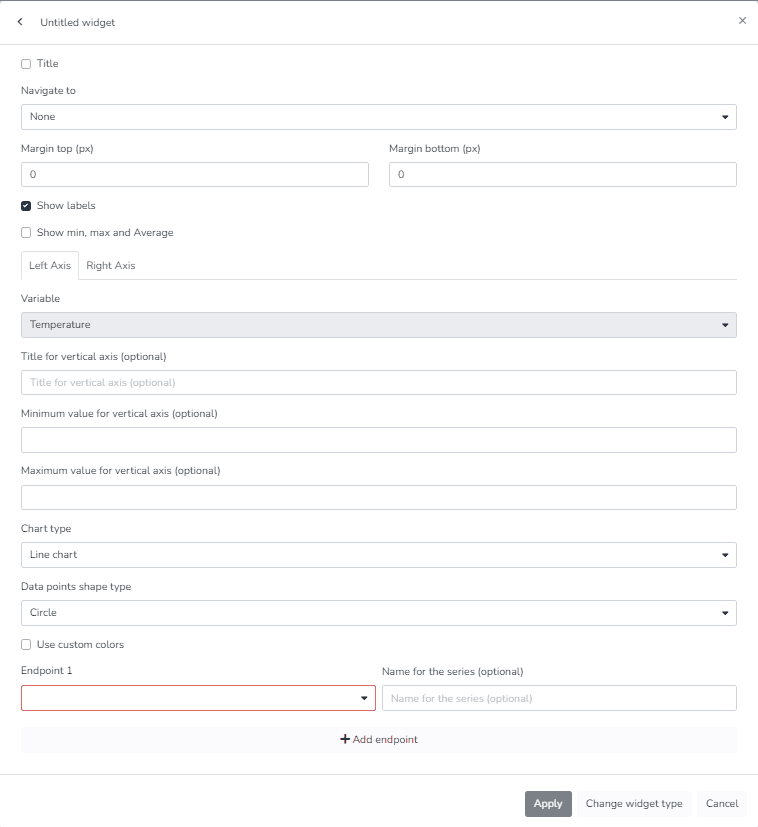
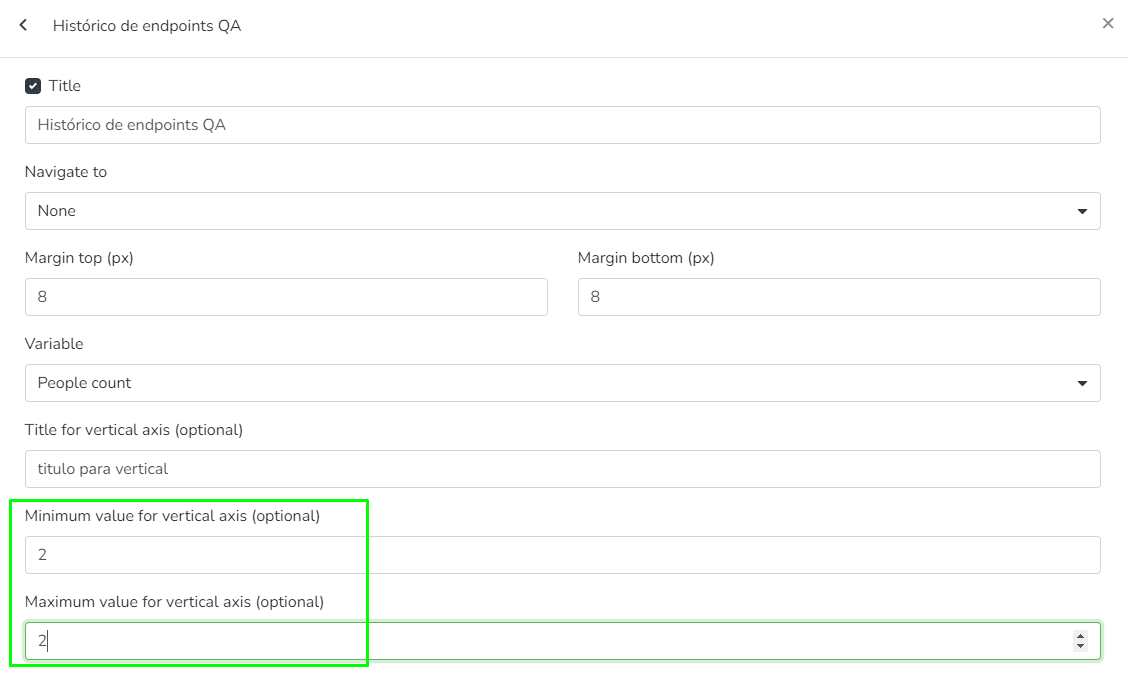
Line chart showing the variation of an endpoint variable type over time. In endpoint history charts, the user can enter minimum and maximum values to define the Y-axis ranges, as well as modify the variable names associated with the Y-axis titles.
Dashboard
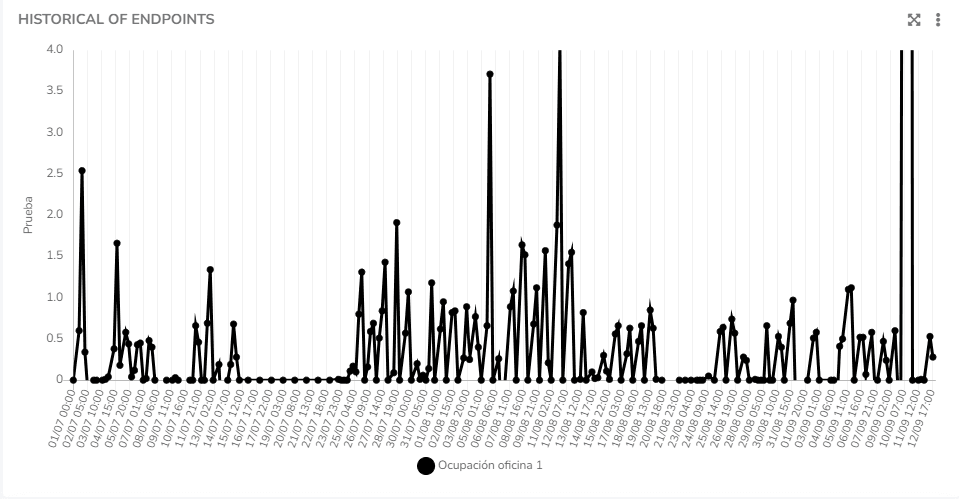
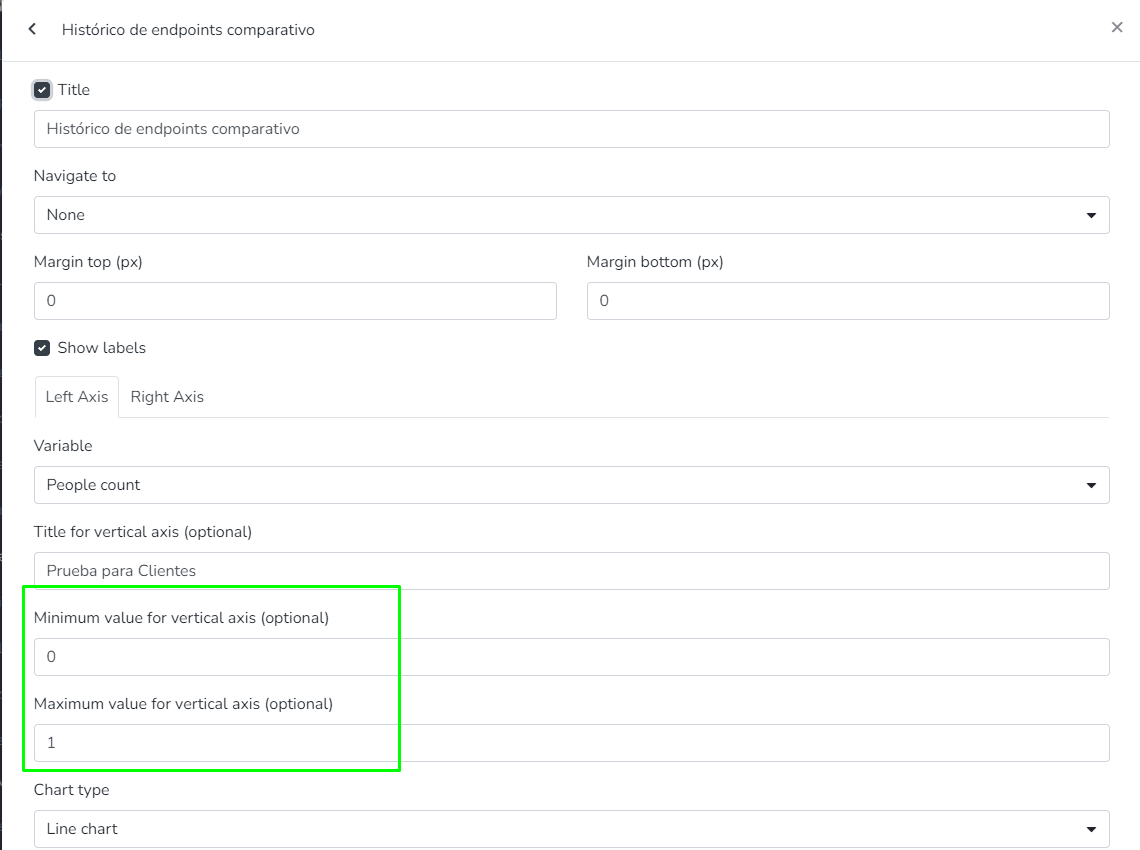
- The user can edit the minimum and maximum values that define the Y-axis ranges of the charts.
This is a visualization of the minimum and maximum values that define the Y-axis ranges of the charts.
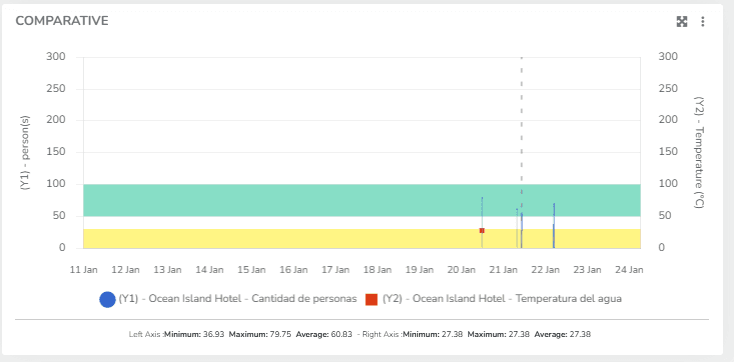
- The user can define Comfort Zones for history charts. This allows configuring value ranges where measurements are expected. It is for visualization purposes and multiple zones can be configured for the same chart.
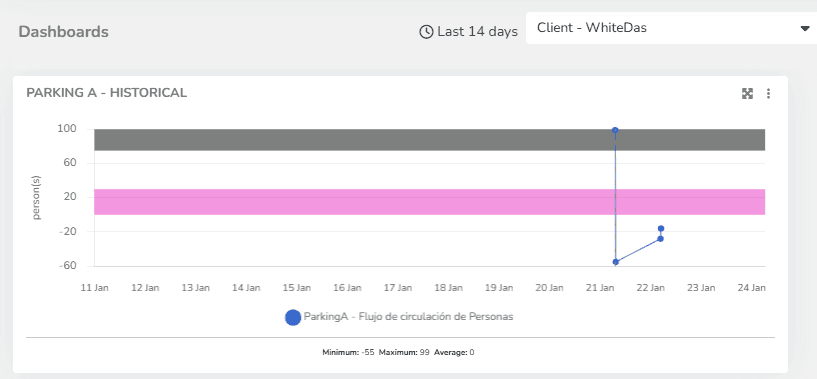
The user can also define Comfort Zones for the Comparative History Widget.
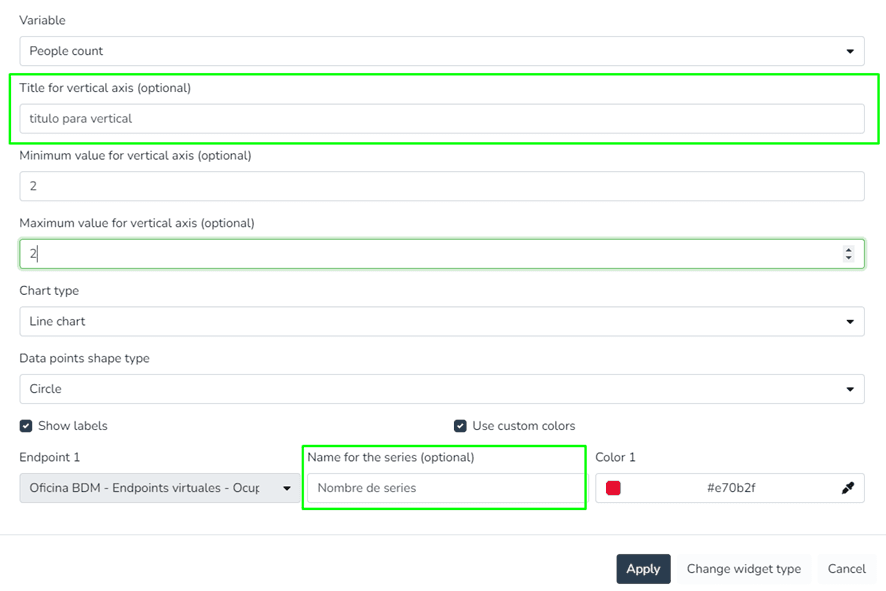
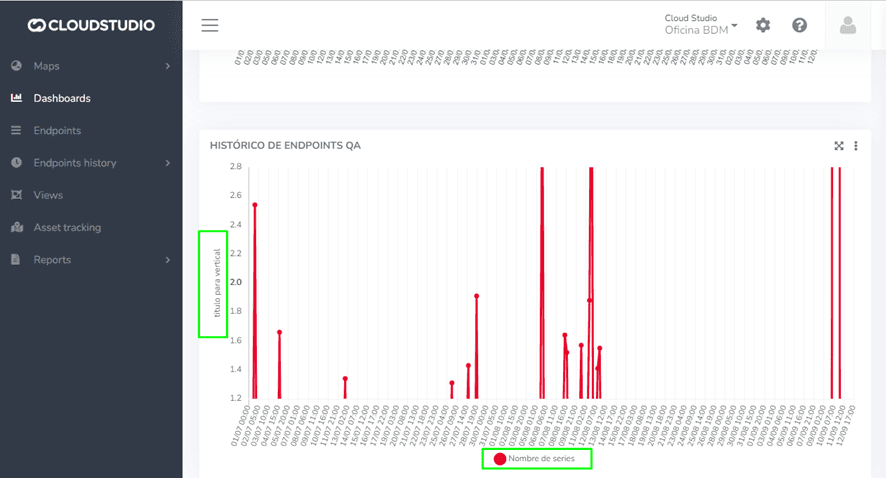
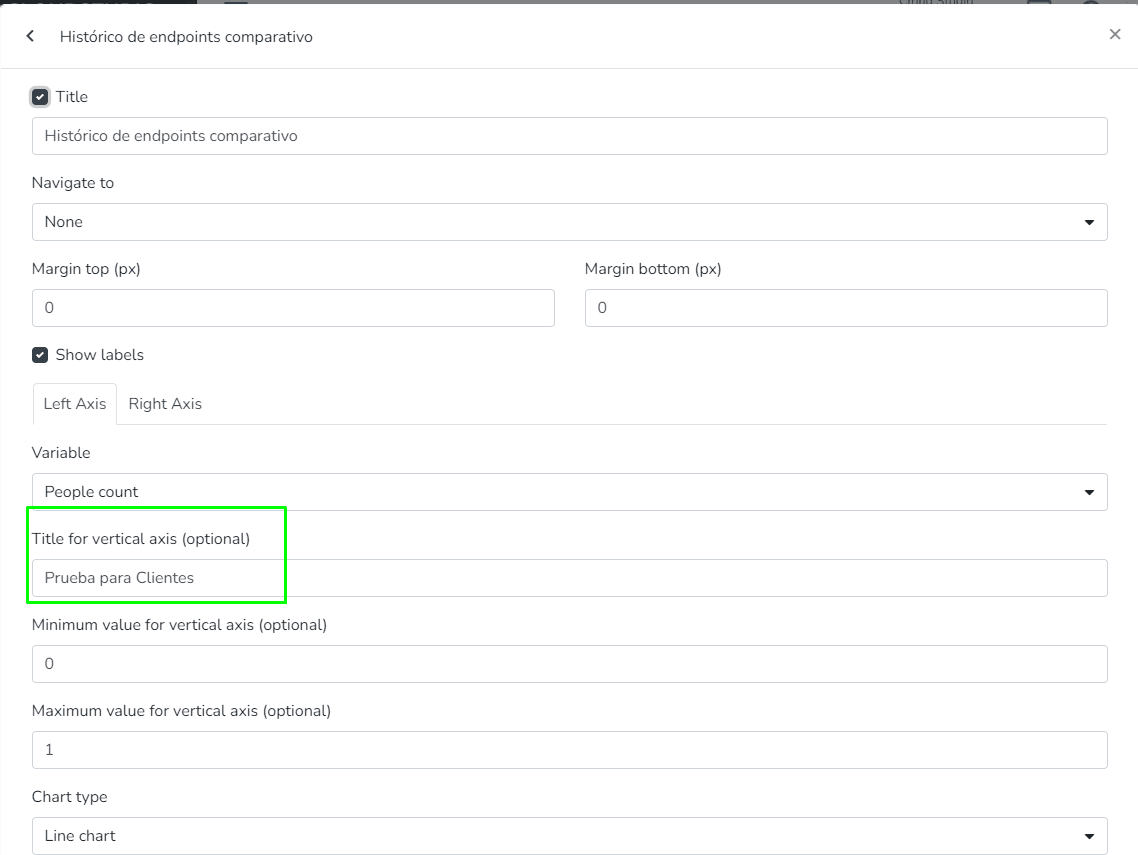
- The user can modify the Y-axis titles (instead of displaying the variable type names).
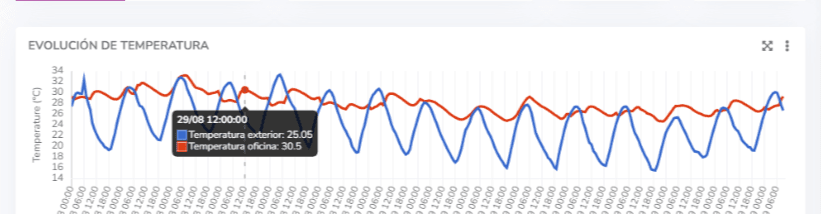
- The user can view the tooltips of history charts, which display all data points associated with an X position.
Comparative Endpoint History Widget:
Endpoint history charts where the user can enter minimum and maximum values to define the Y-axis ranges, as well as modify the variable names associated with the Y-axis titles.
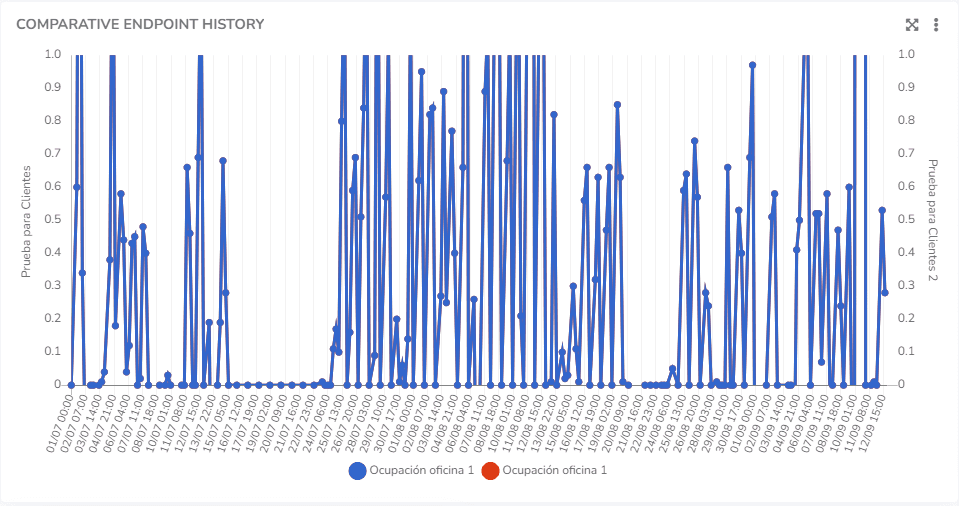
The user can edit the minimum and maximum values that define the Y-axis ranges of the charts.
The user can modify the Y-axis titles (instead of displaying the variable type names).
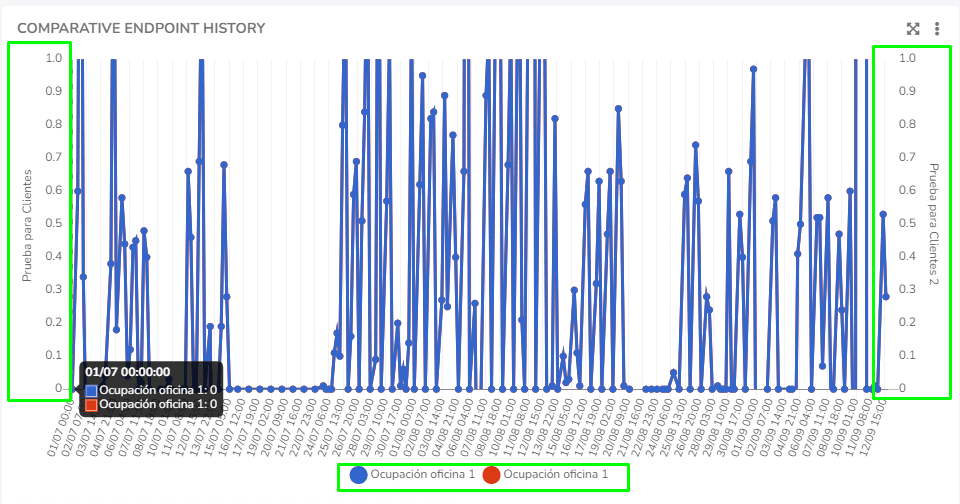
The user can view the tooltips of history charts, which display all data points associated with an X position.
Dernière mise à jour le