18-07-2022
For this production deployment, the following improvements and/or corrections suggested by the client were included:
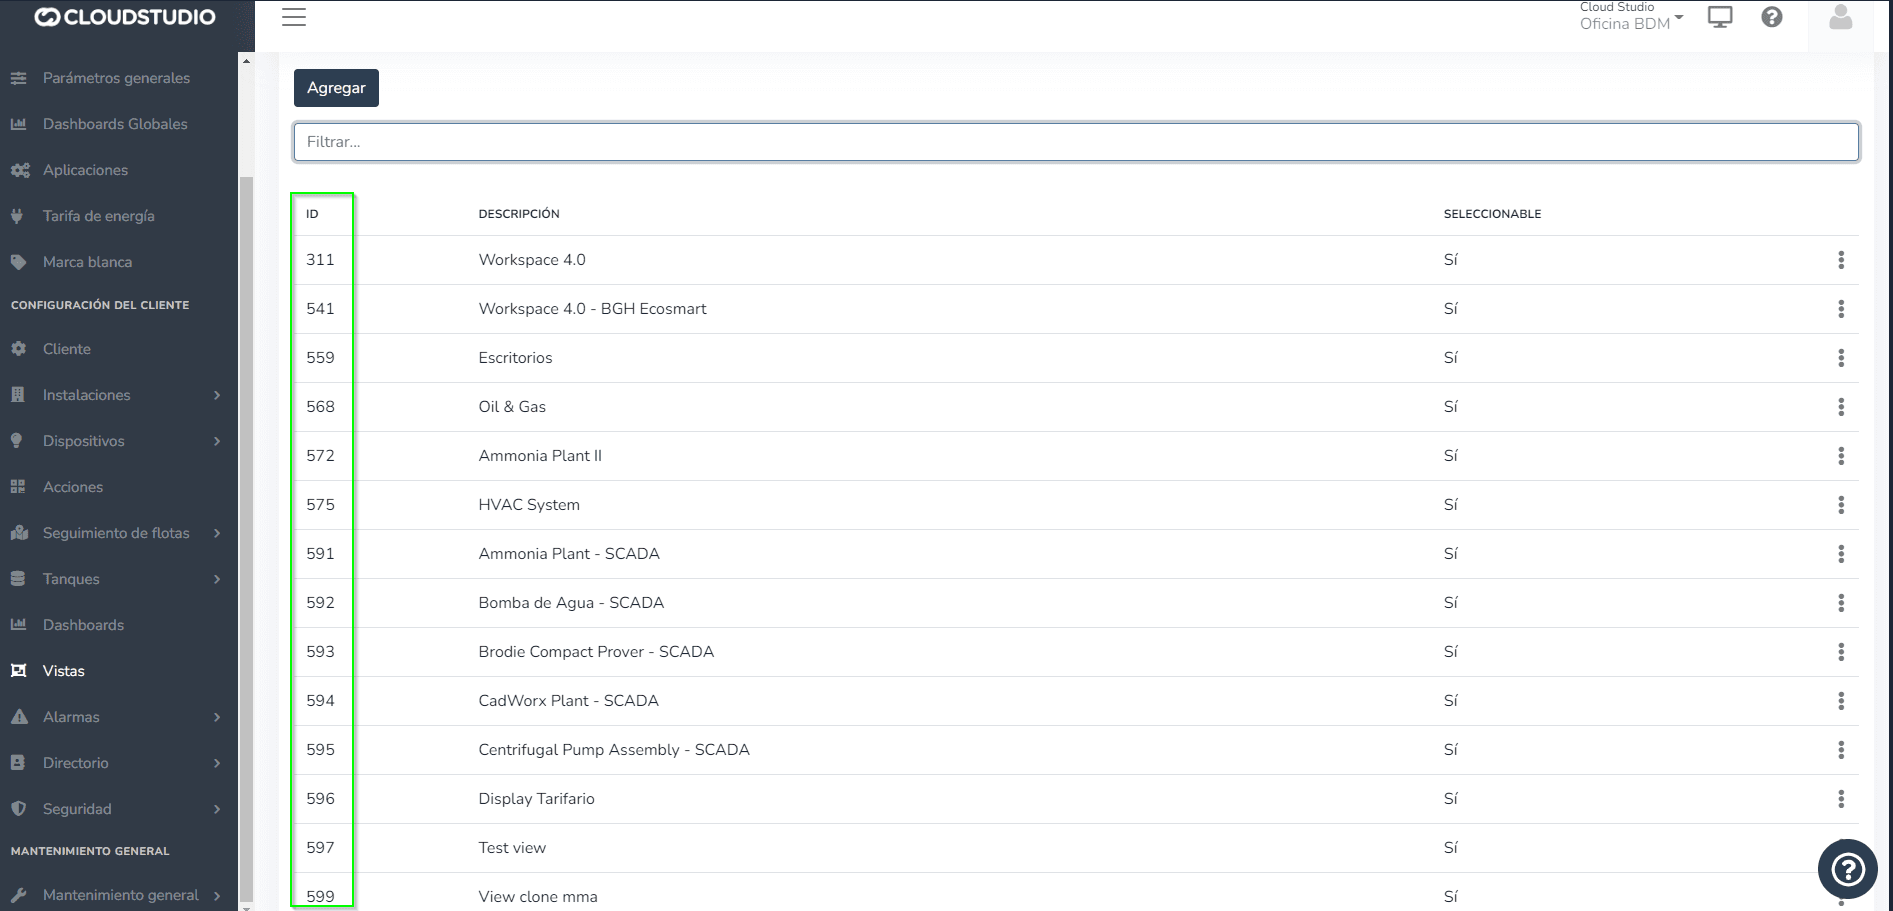
- Show view IDs on the views configuration screen:
- A new ID field was implemented within the "视图" configuration screen to keep them identified, making it easier to search for each one.
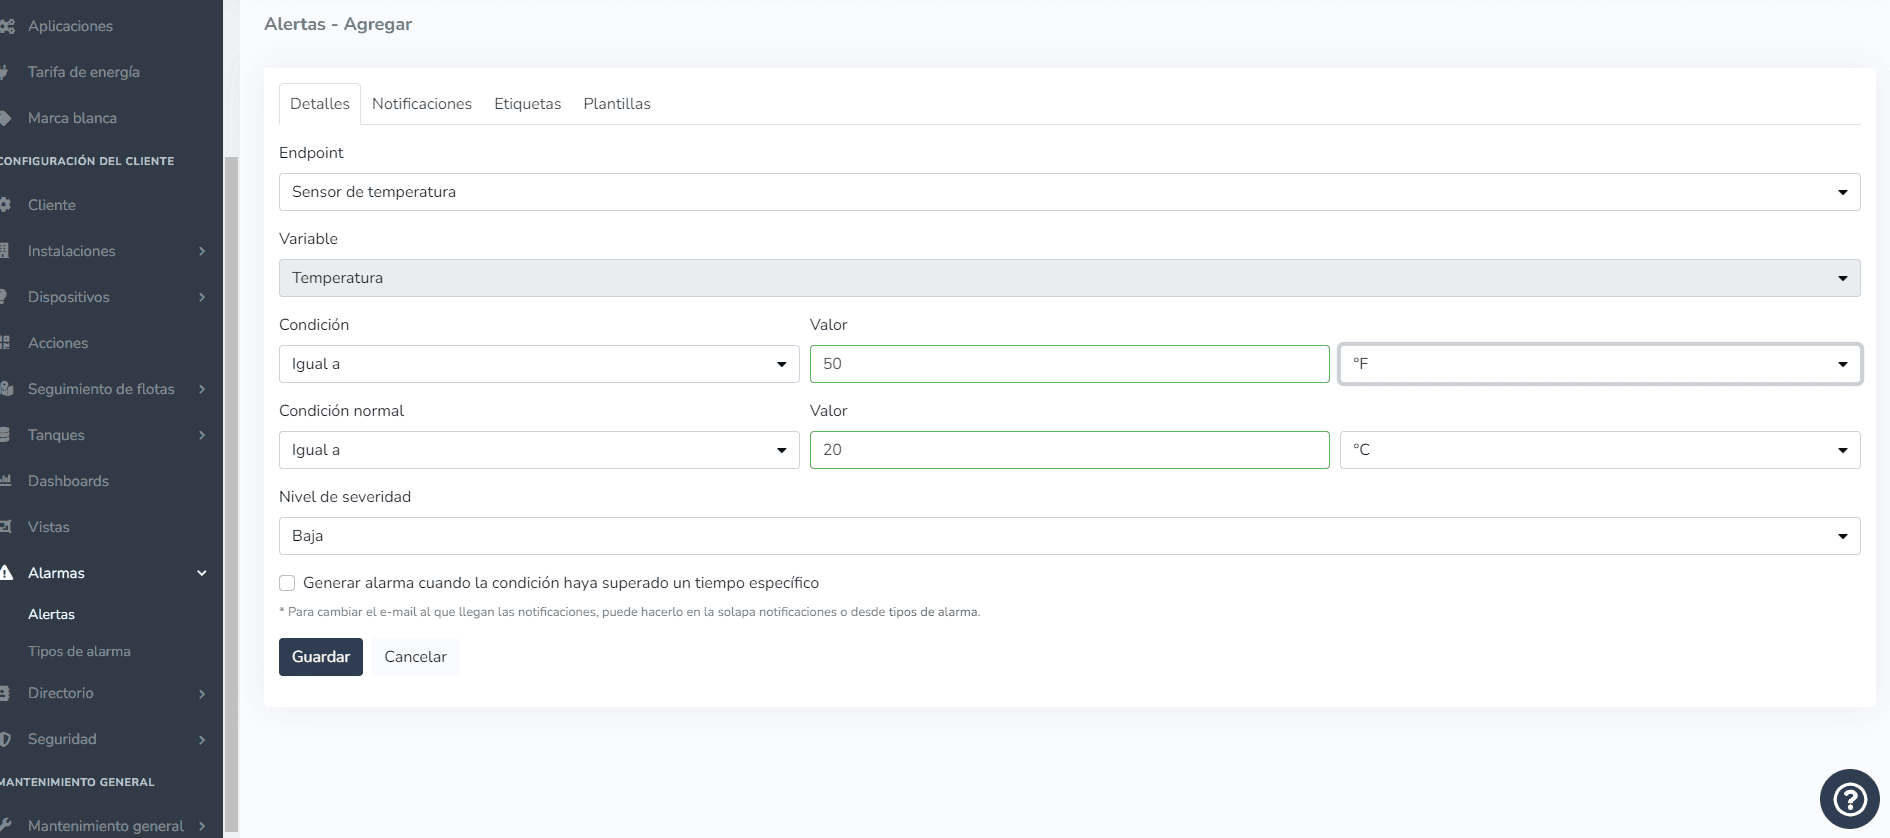
- Measurement Units for the 提醒 feature:
- Units can be defined from the facilities. The unit values are those that will be displayed when creating an alert. For example, for Temperature, we 选择 (degrees C).
- When adding an alert, start by 选择ing the 端点 corresponding to the facility and the value being monitored. As an example, we can convert from (degrees F) to (degrees C), add the value, and 选择 save.
- The next step to verify that the conversion was performed correctly is to edit that same alert and check the value.
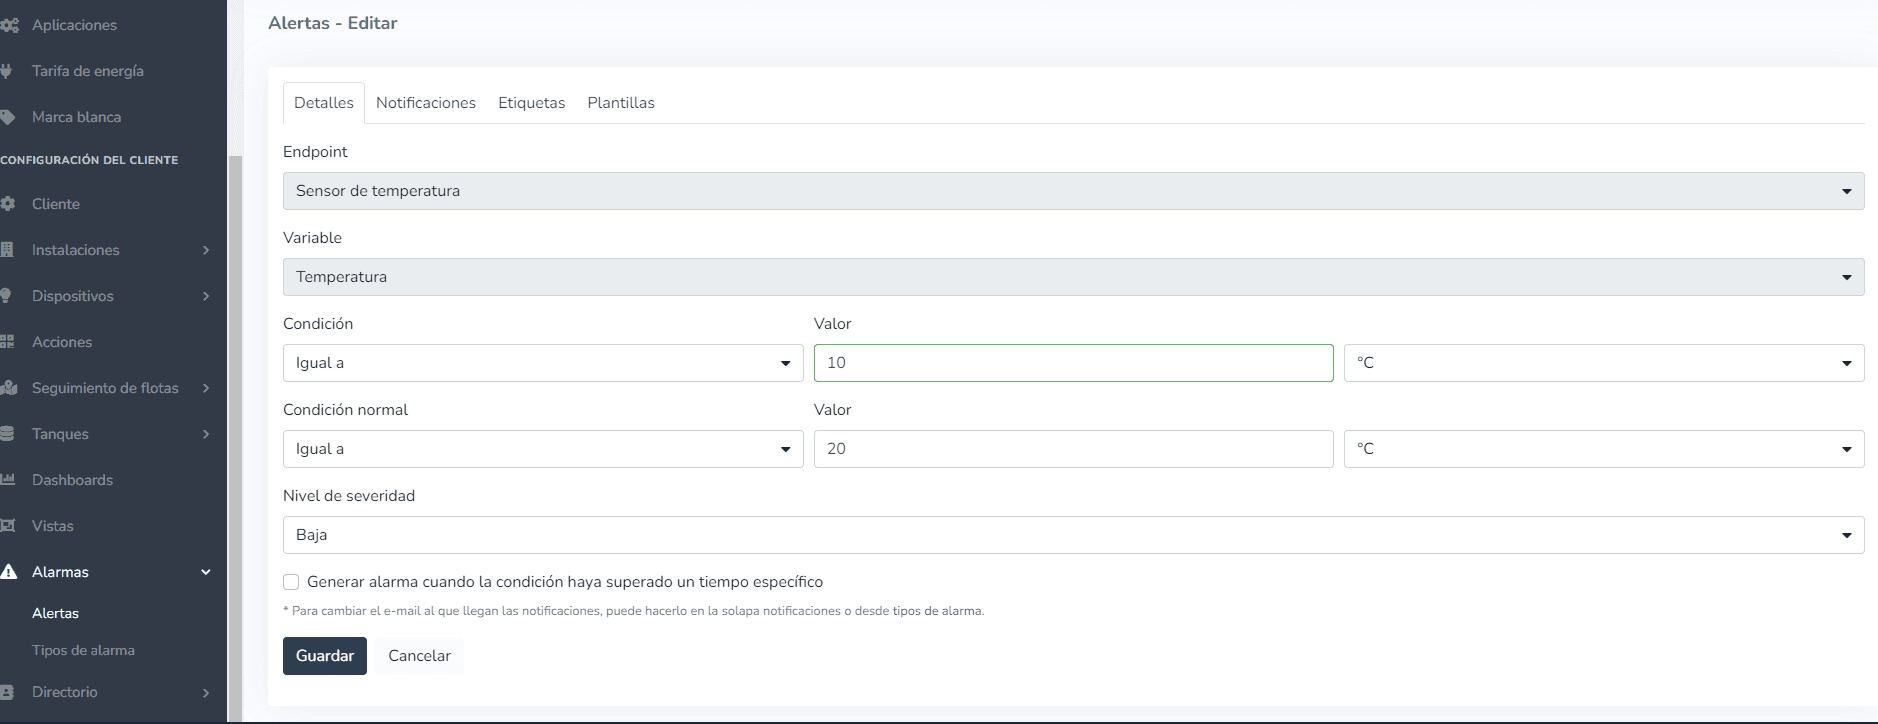
Similarly, you can create an alert with any units, depending on your specific requirements.
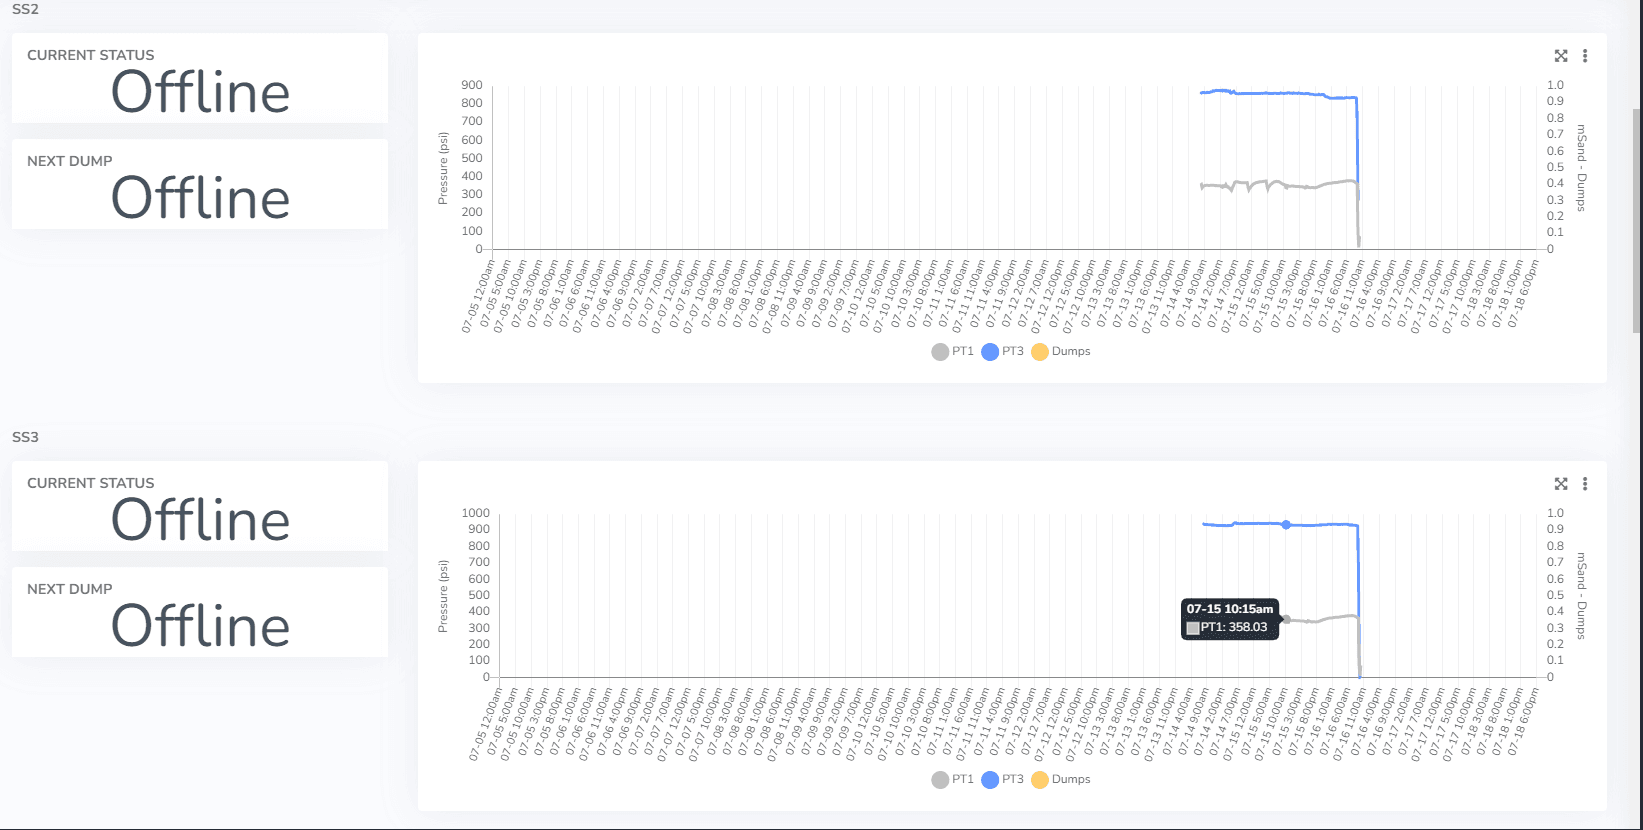
- Monitor 仪表盘 adjustment:
- Fixed cases w此处 a device that has an endpoint not receiving data no longer shows any information in the charts.
- Modified the historical comparison chart tooltip to now only show the highlighted endpoint for viewing detailed information.
- 端点 data history report adjustment:
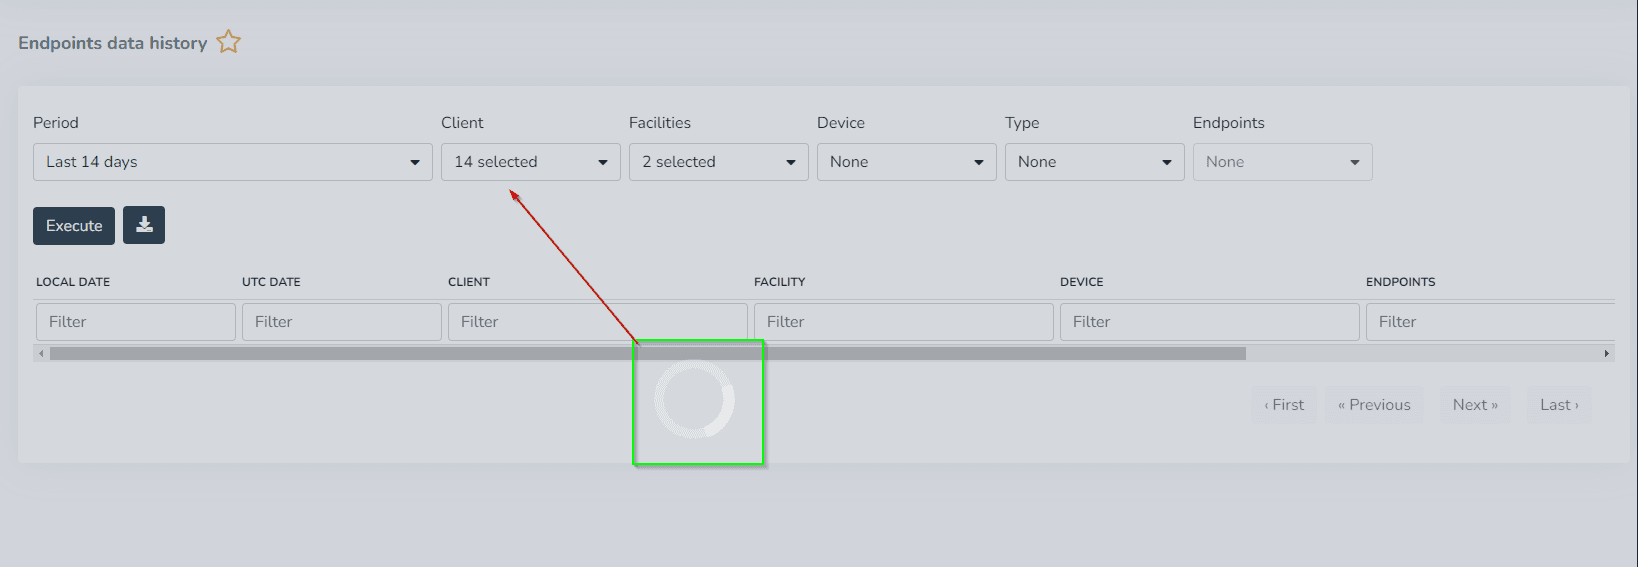
- Multi-选择 fields were configured to load de选择ed, requiring each 选择 to be chosen individually. When the page loads, all multi-选择 fields will appear de选择ed:
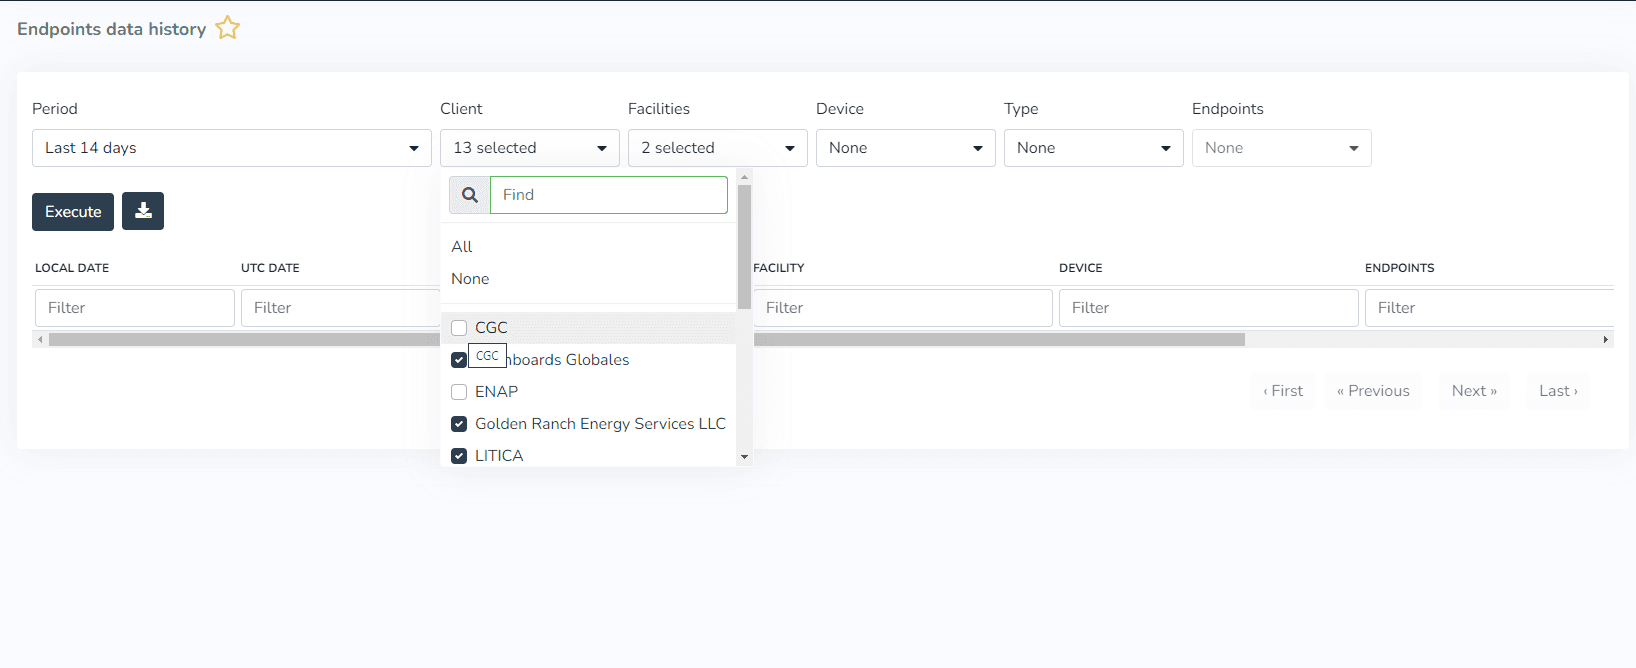
When we 选择, in this case a client, and 点击 outside the multi-选择, we can see how the changes are saved.
最后更新于